In this tutorial, we will explore how to develop a comprehensive predictive maintenance solution for a motor, using NanoEdge AI Studio. This process will guide you from the initial setup to the final implementation, providing hands-on experience in applying edge AI to real-world industrial scenarios.
Here’s the plan:
- Identify normal and abnormal operating conditions specific to this motor use case.
- Determine the key phenomenon to monitor and select an appropriate sensor for data collection.
- Develop data logging code to continuously capture sensor data.
- Design a robust data logging methodology to ensure high-quality data collection.
- Utilize the Sampling Finder tool in NanoEdge AI Studio to determine the optimal sampling rate and buffer size.
- Use the Data Manipulation tool in NanoEdge AI Studio to create datasets from the collected data.
- Complete an anomaly detection project within NanoEdge AI Studio, leveraging the collected data.
- Implement the AI library into your project using STM32CubeIDE.
By the end of this tutorial, you’ll have a fully functioning predictive maintenance system capable of detecting motor anomalies in real time.
1. Initial situation
We have a motor and our goal is to implement predictive maintenance to detect issues early, which will help reduce repair costs and improve reliability. In this scenario, we’re using a motor test bench that allows us to control the motor's speed, choose the direction of rotation, and intentionally create anomalies for testing purposes.
Our objective is to develop a predictive maintenance solution. In other words, we want to differentiate between data generated when the motor is operating normally and data that indicates the presence of issues. To achieve this, we will need to collect and analyze both types of data: data representing normal operation and data from when the motor experiences anomalies.
1.1. Anomalies
Collecting data from a motor or any machine during normal operation is relatively straightforward. However, when it comes to gathering data on abnormal behavior, two key questions arise:
- What constitutes an anomaly?
- How can we create and capture this abnormal data?
If you're interested in implementing predictive maintenance, it's likely because you've already encountered issues or are aware of potential problems that could occur with your motor (or any similar machine). The first step is to identify these possible issues and then determine a method to replicate them. This will allow you to collect the necessary data that reflects these abnormal conditions.
Example of anomalies and how to create them:
Overheating:
- Explanation: caused by excessive load or insufficient ventilation, leading to motor damage.
- How to induce: block the motor ventilation to prevent cooling, or operate it under a heavier load than designed to increase the temperature.
Brush wear (for brushed motors):
- Explanation: over time, brushes wear out, leading to poor contact, sparking, and inconsistent performance.
- How to induce: run the motor at high speed continuously or place it in a dusty environment to accelerate brush wear.
Mechanical blockage:
- Explanation: debris or misalignment can block the rotor, preventing the motor from rotating freely.
- How to induce: introduce small debris or obstacles into the motor mechanism or misalign the rotor shaft intentionally.
Bearing issues:
- Explanation: worn or damaged bearings cause noise and friction, and can lead to motor failure.
- How to induce: remove lubrication from the bearings or introduce dust or sand to accelerate wear.
Rotor imbalance:
- Explanation: imbalance in the rotor causes vibrations and noise, and reduces efficiency.
- How to induce: stick a small weight to one side of the rotor or remove material from it to create an imbalance.
Electrical short circuit:
- Explanation: a short circuit in the motor windings or connections can cause overheating and failure.
- How to induce: incorrectly connect the motor wires to create a short circuit or vary the supply voltage suddenly.
Reduced torque:
- Explanation: caused by under-voltage or excessive friction, leading to poor motor performance.
- How to induce: lower the motor supply voltage or increase friction by applying pressure to the motor shaft.
Power supply problems:
- Explanation: fluctuations in power supply, such as under-voltage or over-voltage, affect motor performance.
- How to induce: supply the motor with a voltage lower or higher than its rated value to observe inefficiency or damage.
In this case, the two issues we aim to detect and prevent are imbalance and a loose belt. To simulate an imbalance, we added a ring with nuts to the motor. For the loose belt condition, we adjusted the belt tension to be either too tight or too loose.
If you’re unable to create the anomalies you want to detect later, an AI solution might not be feasible. AI isn’t magic; it learns to distinguish between different conditions by analyzing numerous examples. In this scenario, it needs examples of both normal and abnormal data to understand their differences, much like how you would learn to recognize them yourself.
2. Type of project: anomaly detection
There are four types of projects in NanoEdge AI Studio:
Anomaly detection:
Train a model to distinguish between two kinds of behavior: nominal and abnormal. This type of project also has the unique capability of being retrained directly on the microcontroller.
N-class classification:
Train a model to classify a signal into predefined categories.
1-class classification:
Similar to anomaly detection, this trains a model to detect outliers in data. Only nominal data is required to train the model, as any data too far from the learned representation will be classified as abnormal. However, this is a last resort solution; anomaly detection generally performs better.
Extrapolation:
Train a model to predict a continuous value instead of a class. This method functions like a classification task with numerous possible categories, where the predicted values are interconnected, unlike the distinct classes in traditional classification.
For our case, we can use either anomaly detection or N-class classification, but anomaly detection is the better choice because we only have two "classes", and due to its ability to be trained directly on the device. Being able to retrain a model with data from its final environment offers greater flexibility and usually results in better detection accuracy. With anomaly detection, you can train a model for a motor and then deploy a specifically retrained model on every motor of the same kind.
3. Data logging
The most crucial part of a NanoEdge project is the data. Creating a project in NanoEdge AI Studio and integrating the model into an STM32CubeIDE project is straightforward because of its user-friendly design.
However, collecting high-quality data can be challenging. A solid methodology and meticulous attention to detail are essential.
3.1. Types of data and sensor
In this project, our goal is to capture both normal and abnormal functioning of the motor. To do this, we need to decide what type of data might reveal these anomalies. In this case, we can consider the following:
- Vibration: since the setup is located in an area without external vibrations, monitoring vibrations is a good approach.
- Current: measuring current is another viable option, but this data is typically more intrusive to collect.
- Sound: sound can be useful, but it is often heavily influenced by environmental factors, and vibrations tend to provide similar information.
For simplicity, we will use a 3-axis accelerometer in this tutorial. Current could have been an alternative, and you may want to experiment with it yourself.
NanoEdge AI Studio is sensor-agnostic, meaning you can use any sensor as long as you specify the number of dimensions (axes) being used. However, two key parameters need to be defined: the buffer size and the data rate at which data is collected. These parameters have a significant impact on the results you’ll achieve.
To test multiple combinations of buffer size and sampling rate without needing to collect data for each combination, we will first gather continuous data at the maximum data rate supported by our sensor. We will then use a tool in NanoEdge AI Studio called the Sampling Finder to determine the optimal starting points for both data rate and buffer size.
Once the data rate and buffer size have been determined, we will use another piece of code to log data in regards to these parameters for the final deployment of the AI library on the microcontroller.
3.2. Setup
To collect vibration data, we will use the STEVAL Proteus board and an STLINK-V3 mini probe to program the code on the Proteus board.
We will use the board’s ISM330DHCX 3-axis accelerometer at its maximum sampling rate of 6667 Hz. Using the maximum sampling rate allows us to downsample the data later if needed.
We will place the sensor near the motor, in a location where we expect to capture relevant vibration data. The placement of the sensor significantly influences the data you collect and, consequently, the results you obtain. Depending on the outcome, you may need to experiment with different sensor placements.
3.3. Data logger
To collect data, we need to write some code and program it onto the STEVAL-PROTEUS1 board.
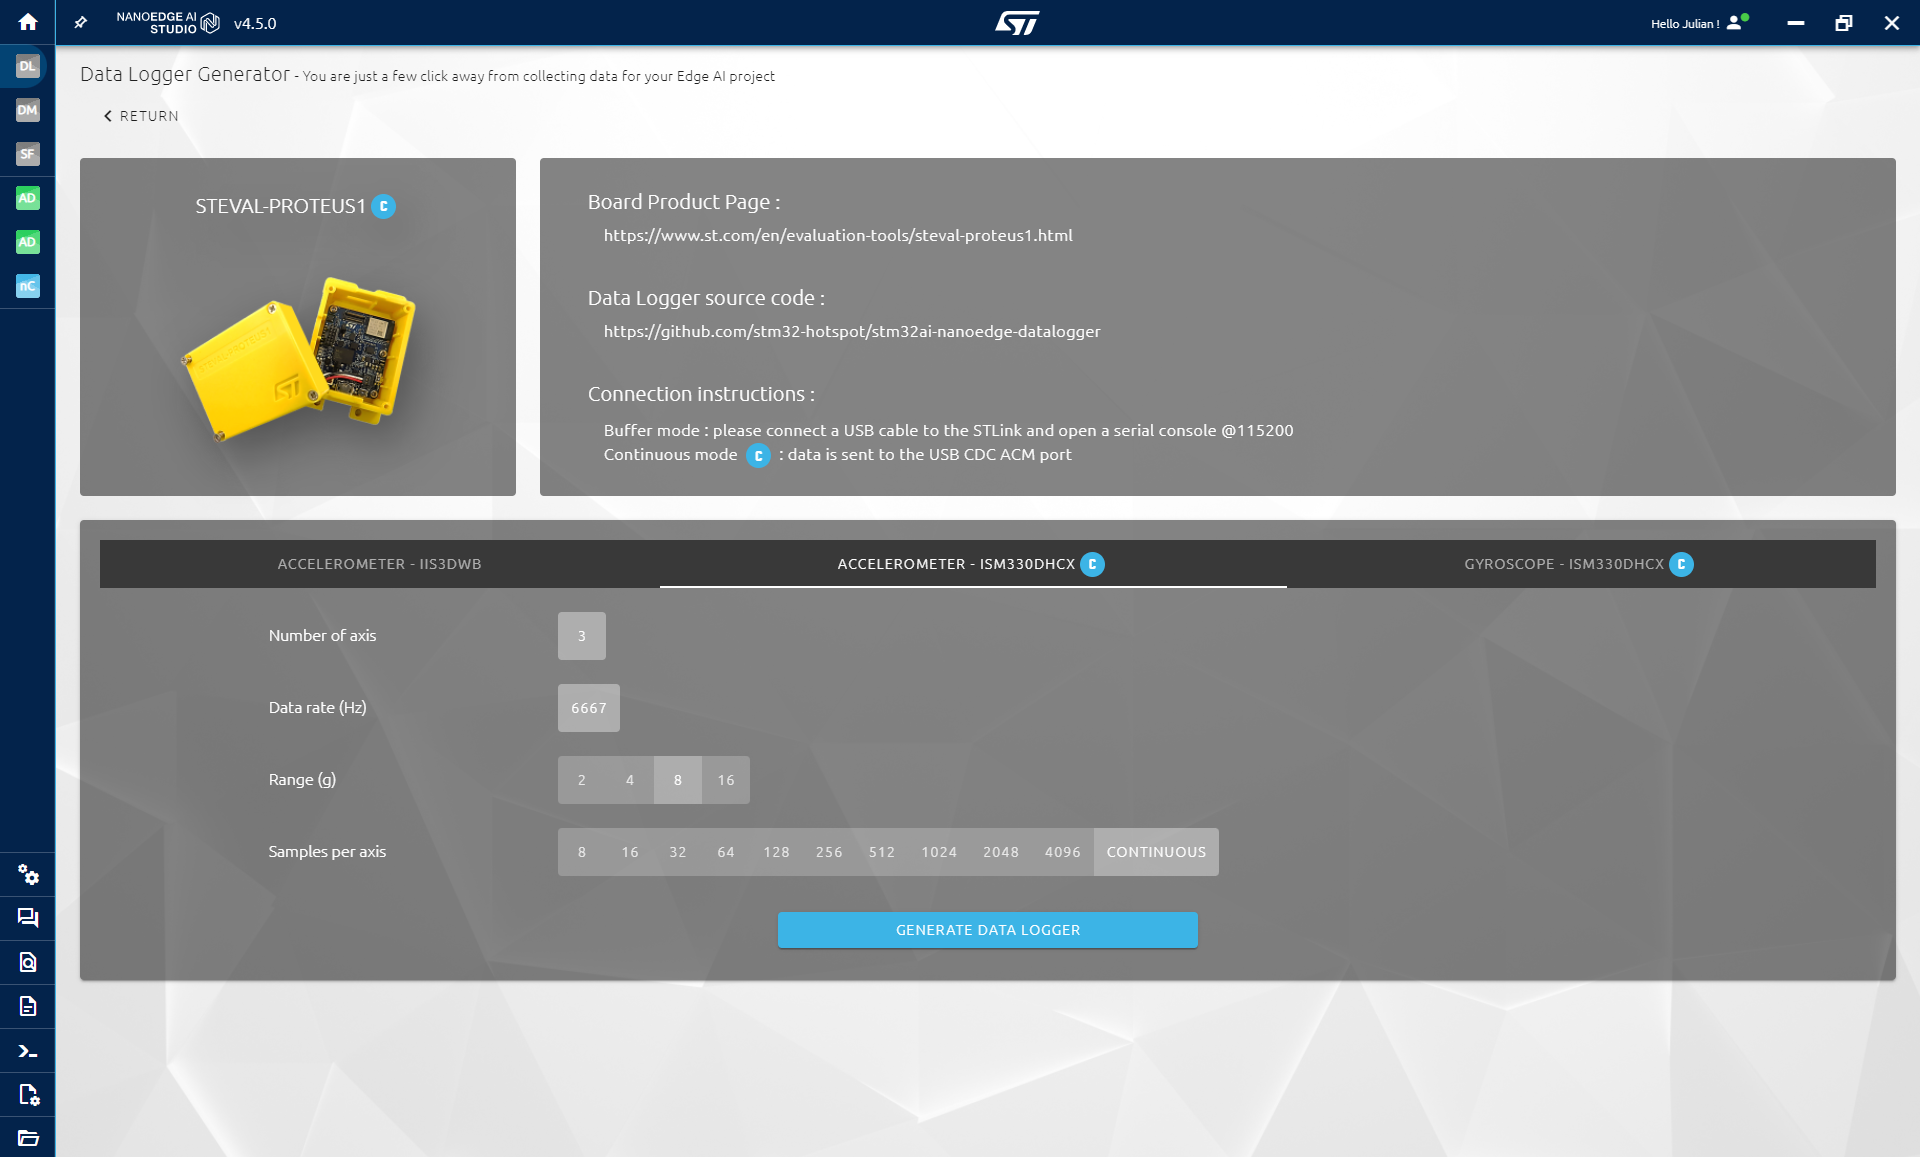
NanoEdge AI Studio provides a tool called the Data Logger Generator, which allows you to generate data-logging code for a predefined list of STMicroelectronics evaluation boards with just a few clicks. STEVAL-PROTEUS1 is one of the supported boards.
- Open the Data Logger Generator tool.
- Select STEVAL-PROTEUS1.
- Open the ISM330DHCX 3-axis accelerometer tab.
- Set the sampling rate to 6667 Hz and select Continuous mode.
- Click on Generate Data Logger.
The source code is available here: GitHub - stm32-hotspot/stm32ai-nanoedge-datalogger
Finally, connect the Proteus board and the ST-LINK V3 mini to your PC, then drag and drop the data logger binary file to program it onto the board.
3.4. Data collection methodology
The data used to train models is the most crucial aspect of an AI project. If the data doesn’t contain the necessary information to address the problem, the model will not perform well. Ensuring good data involves:
- Choosing the right data types, (for example, vibration, current, or sound) which are relevant to your problem.
- Smart data logging: if you want to classify issues, avoid collecting data when the system is not operating, as this can result in similar data across multiple classes.
- Selecting the correct sampling rate and buffer size: you won’t know the optimal settings upfront, so this often requires an iterative approach. We’ll use the Sampling Finder tool to identify the right starting point.
- Gathering sufficient data: the amount needed depends on the use case, but typically, you’ll need more than just 10 signals per class.
Here’s the plan for our data collection (it’s extensive, but it’s better to invest time in gathering quality data upfront rather than having to redo the process multiple times):
- Start the motor at 1080 rpm in a normal state.
- Wait approximately 30 seconds for the motor to stabilize.
- Collect data for 10 minutes.
- Increase the speed to 1670 rpm, wait briefly, and collect data for 5-10 minutes.
- Increase the speed to 2350 rpm, wait briefly, and collect data for 5-10 minutes.
Then:
- Modify the setup to create the first anomaly (misalignment).
- Repeat the three logging phases for each speed setting.
- Modify the setup again to create the second anomaly (unbalance).
- Repeat the three logging phases for each speed setting.
Next:
- Change the direction of rotation.
- Repeat the entire process (nominal and anomalies for each speed).
Following this procedure ensures the quality of the data. Ideally, you want to repeat the entire procedure multiple times. Repeating the logging process multiple times helps capture a broader range of data, accounting for slight variations that occur when assembling and disassembling the motor to create anomalies and then returning it to its normal state.
As you can see, this process is somewhat tedious, but collecting good data is the most important task required from the user. After that, NanoEdge AI takes over.
These files contain continuous data. We will now use the Sampling Finder to test different combinations of sampling rates and buffer sizes. Based on the results, we’ll create new datasets using the data we’ve collected to start our project.
3.5. Sampling Finder
To determine the optimal starting point for the sampling rate and buffer size, we will use the Sampling Finder tool. This tool utilizes our continuous data, generating various combinations of buffer sizes and sampling rates, and performs fast machine learning to approximate the results you might achieve in a real project. Keep in mind that this is only an approximation; you may need to adjust the parameters based on the actual results.
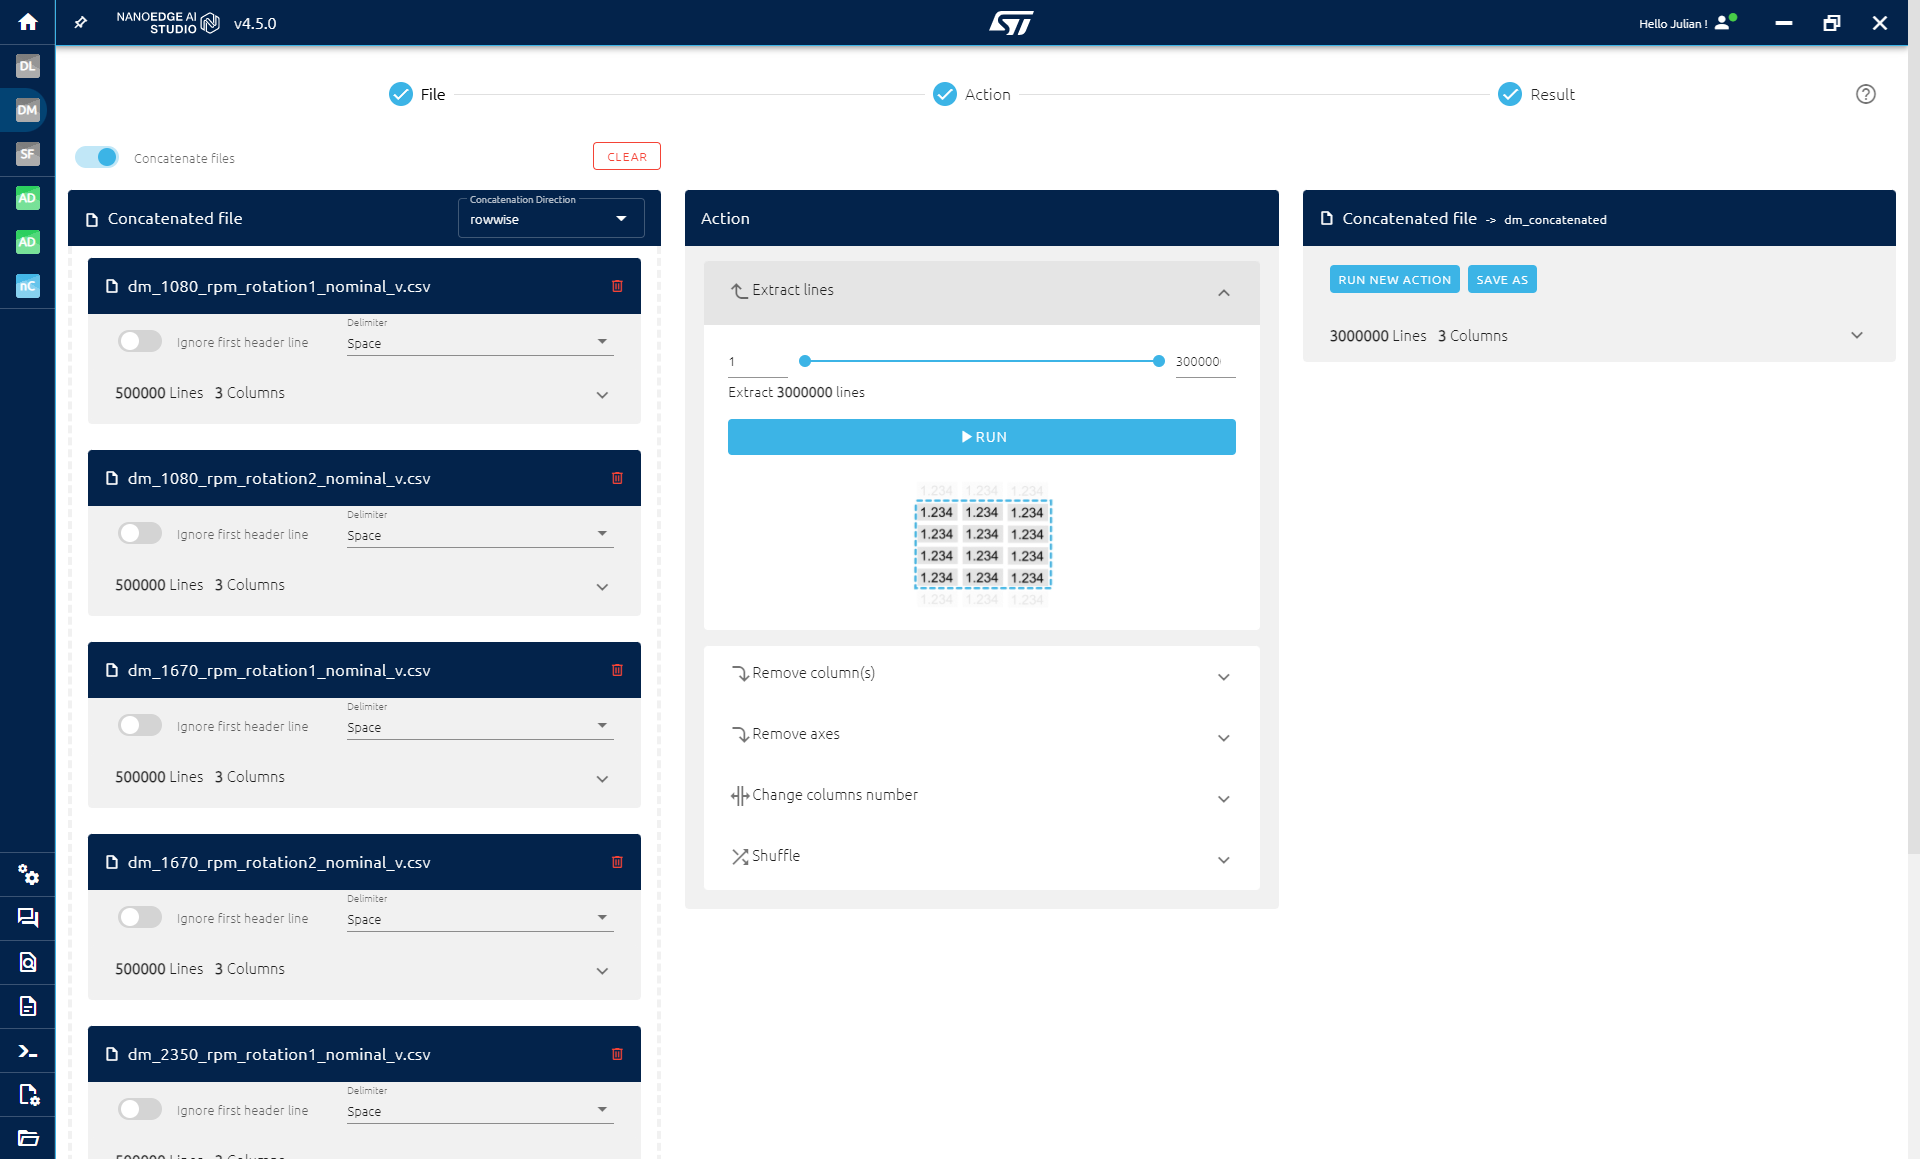
To distinguish between nominal and abnormal data, we first need to concatenate all the nominal files together, and do the same for the abnormal files. In the Data Manipulation tool:
- Import all nominal files.
- Click on Concatenated file and select rowwise for the Concatenation Direction.
- Click on Extract lines and then Run.
- Save the output.
Repeat the same steps for the abnormal files.
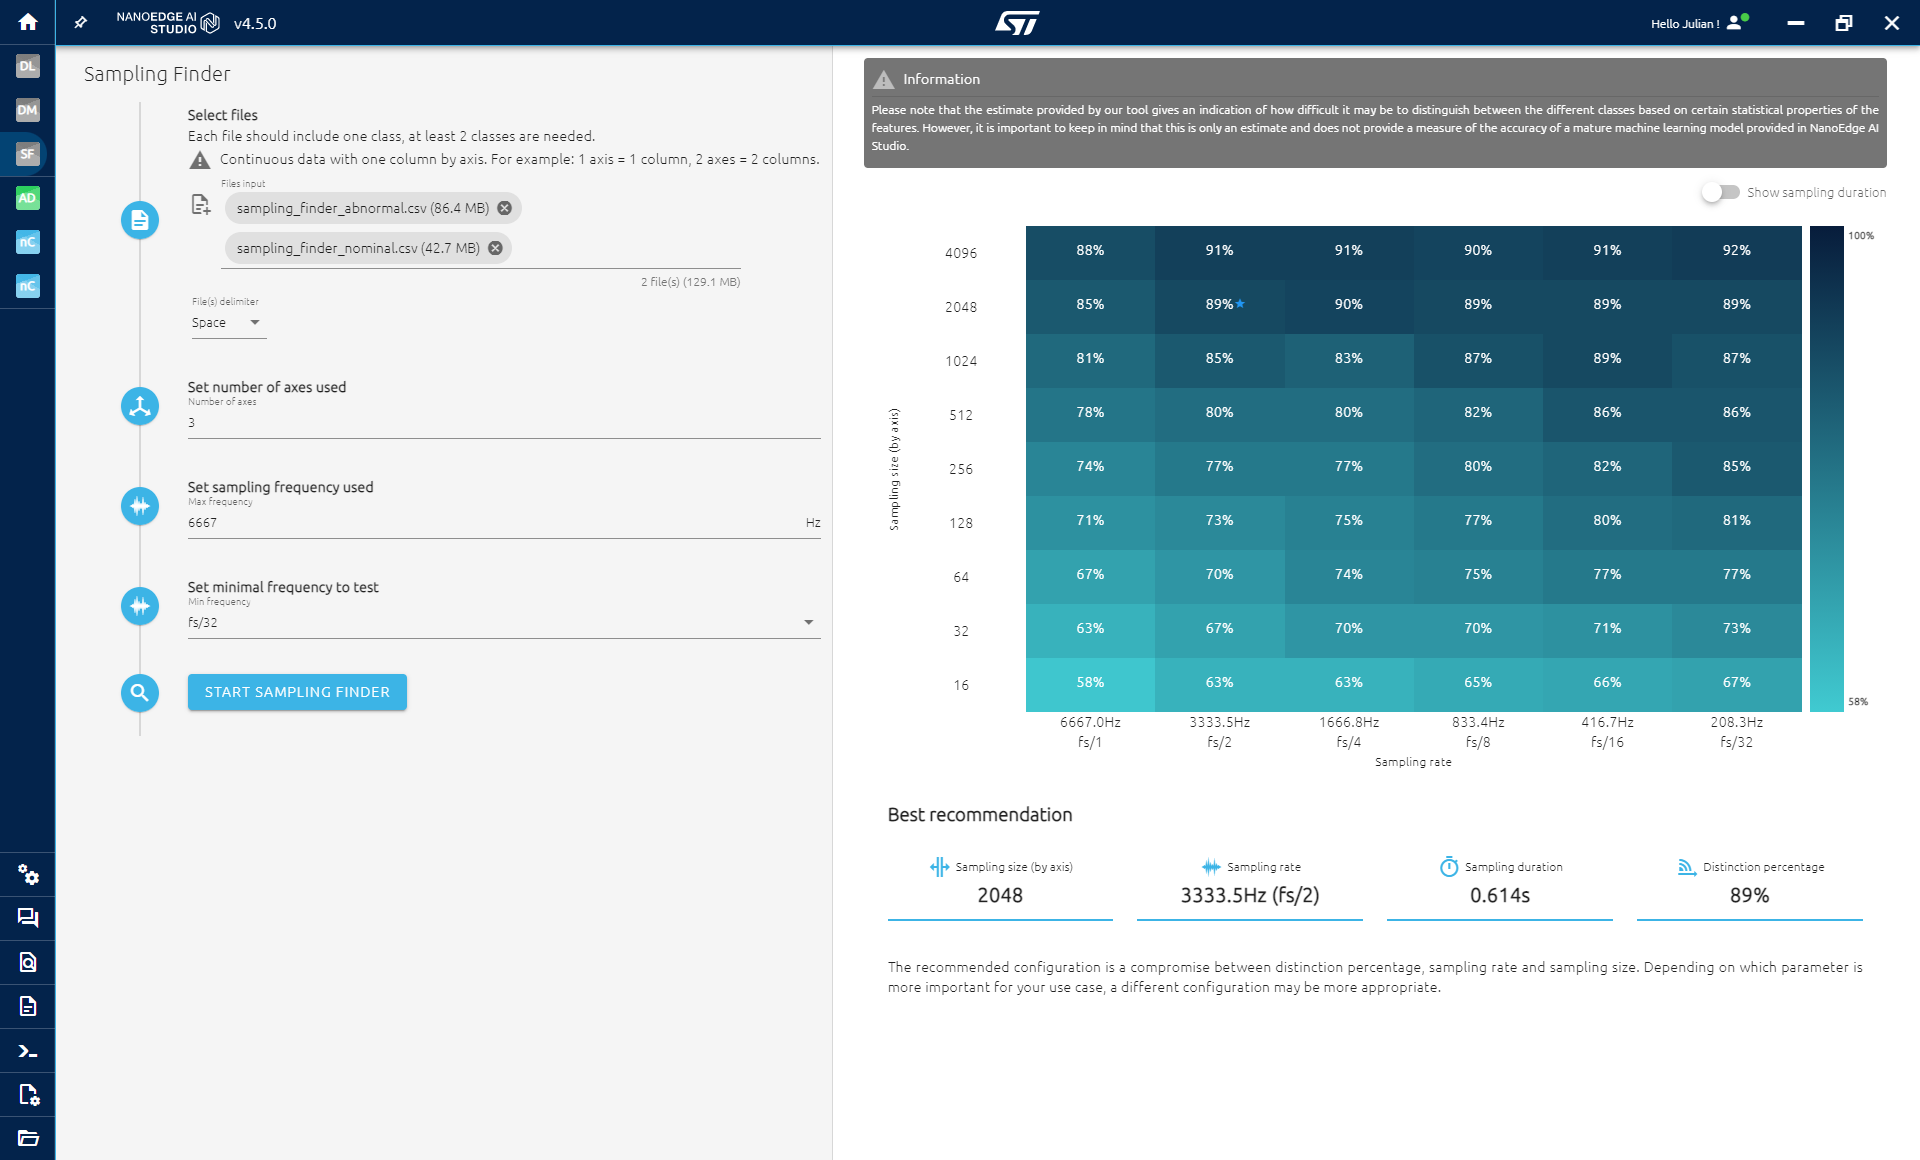
For the Sampling Finder:
- Import both concatenated files, one for nominal data and one for abnormal data.
- Enter 3 as the number of axes used.
- Enter 6667 Hz as the sampling rate used.
- Select fs/32 to test our sampling rate divided down to 12 times.
- Click on Start sampling finder to run the tool.
For each combination, the tool provides an approximation of the accuracy you might achieve in a real benchmark.
As shown, the tool suggests that the best buffer size is 2048 (across all three axes) with a sampling rate of 3.3 kHz (which is our initial sampling rate divided by 2).
Keep in mind that it is a recommendation, a starting point. The recommended combination can be awkward at times because it takes into account both the score and the time need to collect the data based on the sampling rate and buffer size. Sometimes you get a much better score in the real benchmark than in the prediction made by the tool, so always launch a benchmark to get an idea of the performances. You can also try another combination later if the chosen one does not give expected results.
3.6. Creating datasets
Because we logged continuous data, we can reshape it to fit the parameters we determined. In NanoEdge’s Data Manipulation tool, follow these steps to adjust the data:
To downsample:
- Import all the files.
- Click Change Column Number and enter 6.
- Click Run New Action.
- Click Remove Column(s) and delete columns 4, 5, and 6.
- This process divides the sampling rate by 2.
- Click Run New Action.
To reshape as buffers:
- Click Change Columns Number and enter 6144 (which is 2048 * 3 axes).
- Click Save All Files.
Train and test sets:
We need to create a training set to find the best AI model and a test set to ensure the chosen model works effectively.
By default, during the benchmark phase of anomaly detection, 100 splits are made on the imported data. This means 100 training sets and 100 test sets are generated. Models are trained on the training sets and tested on the test sets, providing minimum, maximum, and average accuracy results. This approach helps prevent overfitting (where a model performs well on training data but poorly on new, unseen data).
It's also a good idea to reserve a portion of the data from the training set for additional testing after the benchmark (in the validation step) to further compare the models identified during the benchmark.
When using the train/test approach, ensure that the data is shuffled. You don't want all your training files to contain data from the beginning of the logging session while the test files only contain data from the end. Variations in data, such as temperature changes in a motor, can occur, leading to small differences. Shuffling the data ensures that both training and test sets include a comprehensive range of examples, covering the full spectrum of situations encountered.
4. NanoEdge AI Studio
4.1. Project settings
Now that we have our data ready, we’ll create an anomaly detection project.
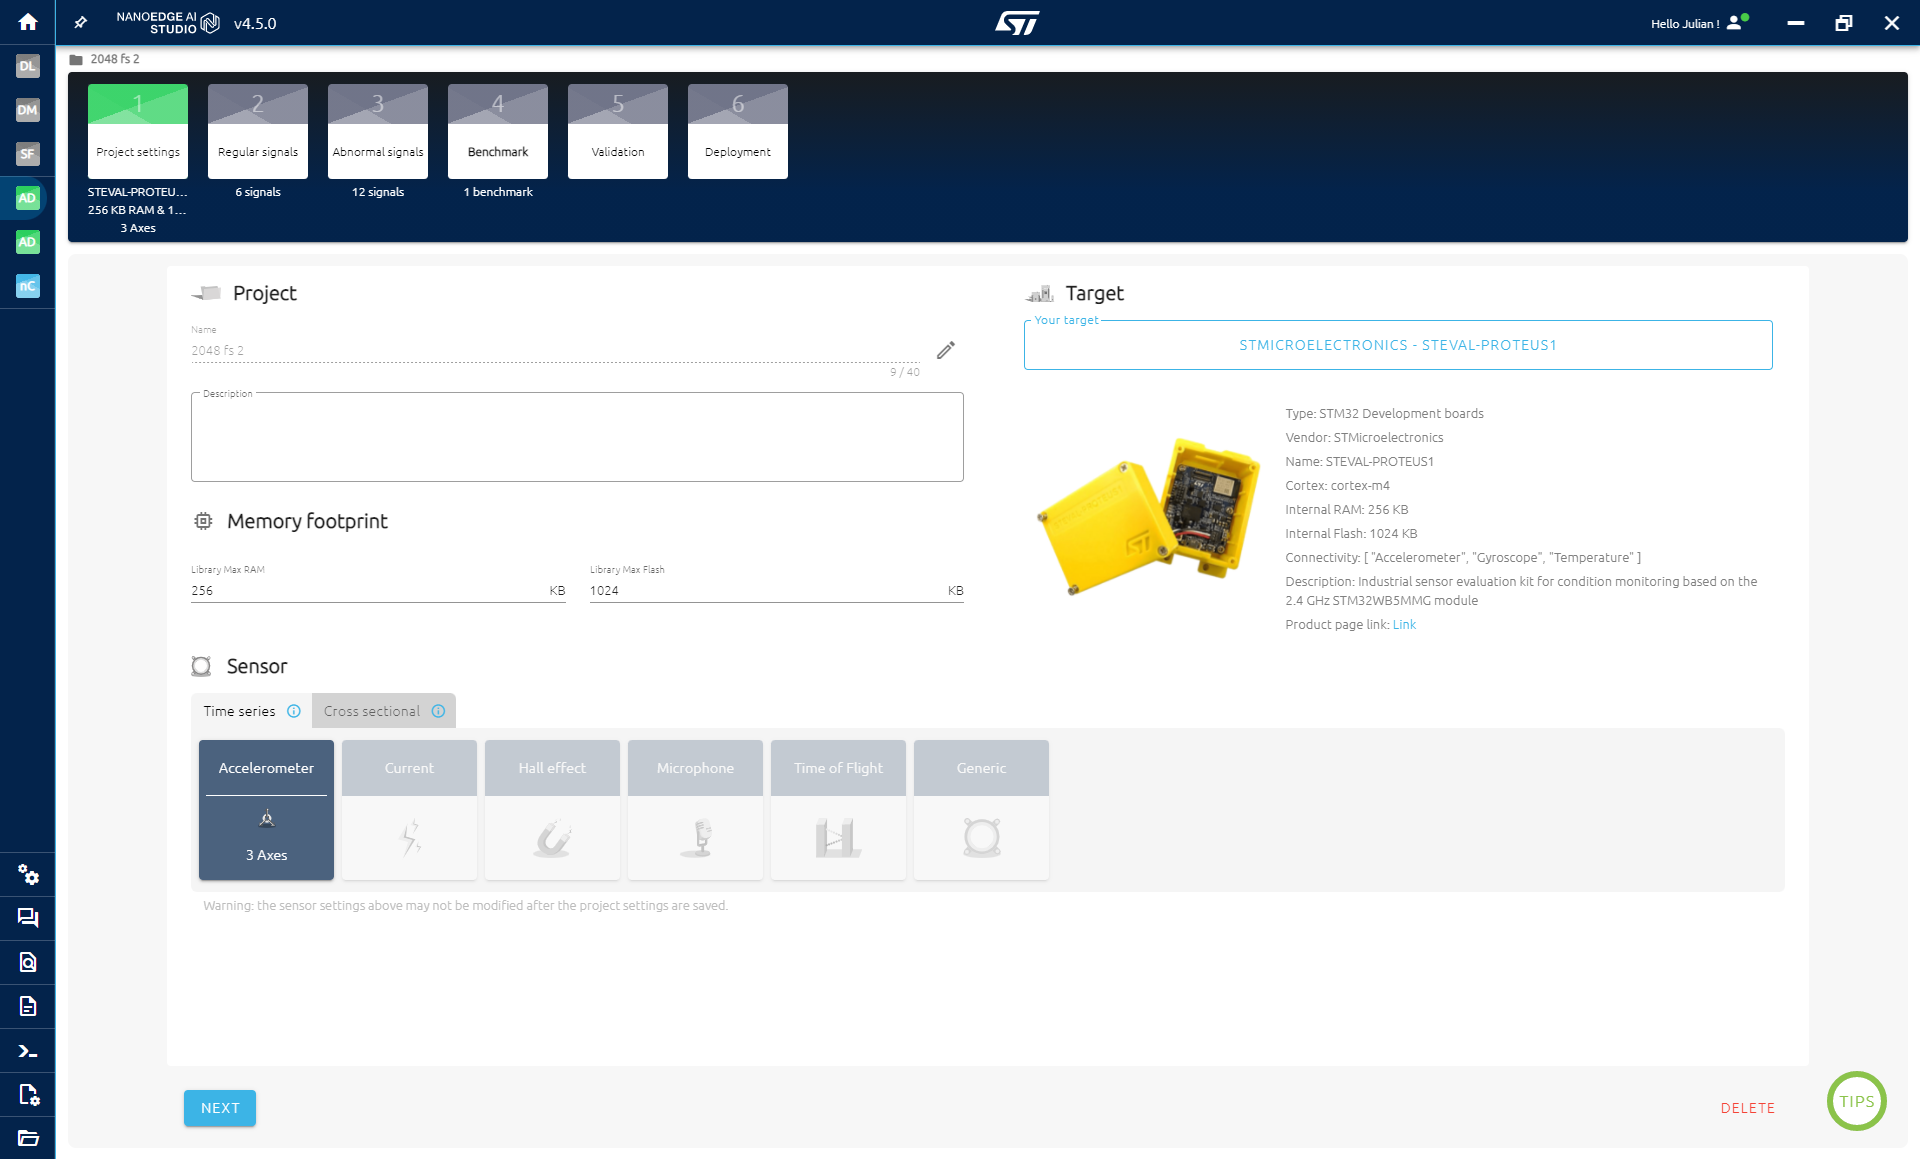
In the project settings:
- Enter a name for your project.
- Select STEVAL Proteus as the target.
- Choose Accelerometer 3 Axis as the sensor in Time Series.
4.2. Signals
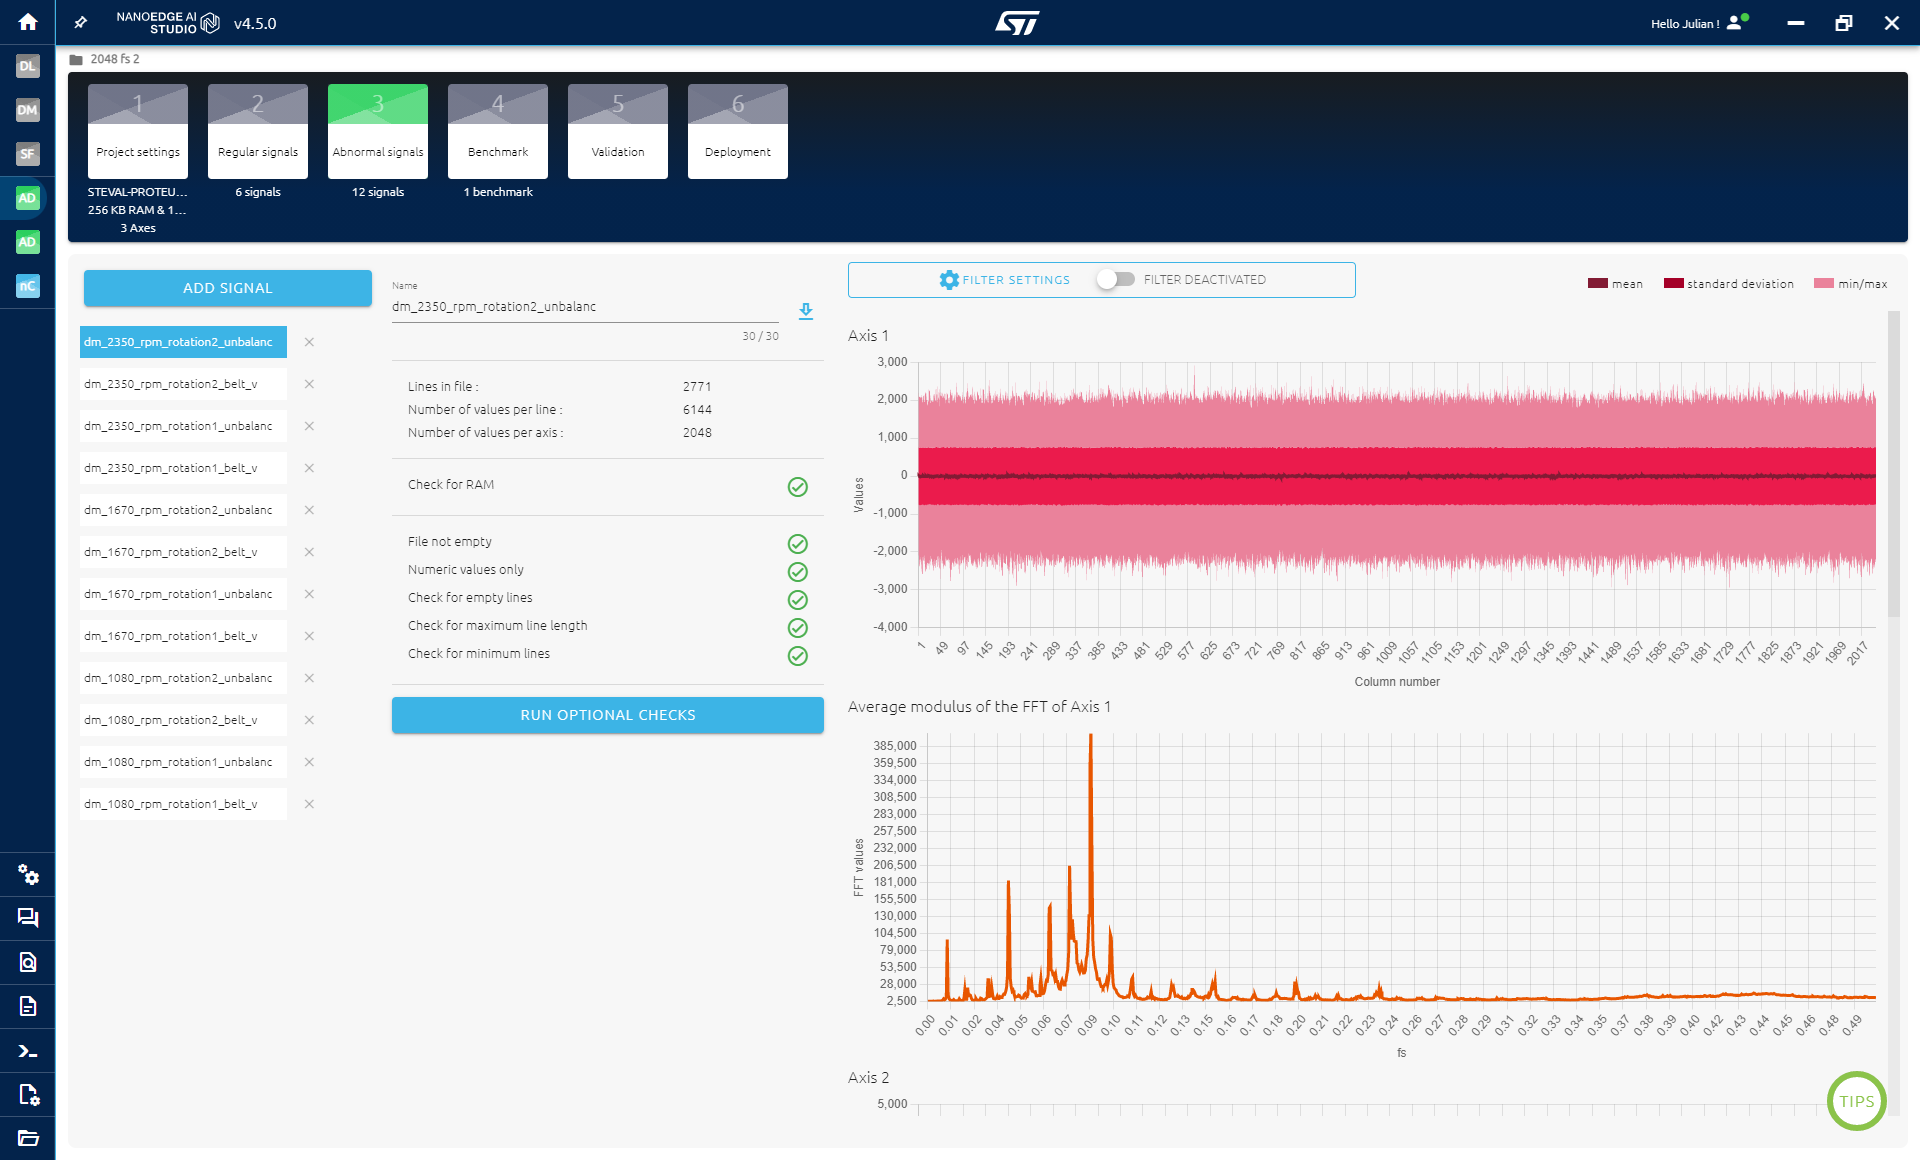
In the regular signals step, import all training nominal files.
In the abnormal signals step, import all training abnormal files.
Every imported file in these steps are an example of nominal and abnormal behavior that NanoEdge AI Studio will use in the benchmark to find the best AI Library.
4.3. Benchmark
We are now ready to launch the benchmark. Click on "Start New Benchmark" and select all files.
The benchmark is an algorithm designed to identify the best combination of data preprocessing, model types, and model parameters. It explores hundreds of thousands of combinations and provides the best results. For more details, see this page.
The more data you have, the longer the benchmark may take to converge on a good solution. You are not required to complete the benchmark if it takes too long; the goal is to achieve a score of at least 90%, which considers balanced accuracy, RAM, and flash memory consumption.
Two scenarios may occur:
- Good scenario: you achieve at least 90% accuracy and are satisfied with the results. Proceed to the validation step.
- Bad scenario: you do not reach 90% accuracy. In this case, consider the following:
- Close to 50% accuracy: the data might not contain sufficient information to solve the problem. Consider using different data.
- Approximately 70% accuracy: results may improve by experimenting with different sampling rates and buffer sizes. Try varying the sampling rate and using buffer sizes from 256 to 4096. Ensure that your data collection is accurate—verify that you are not mixing nominal and abnormal data.
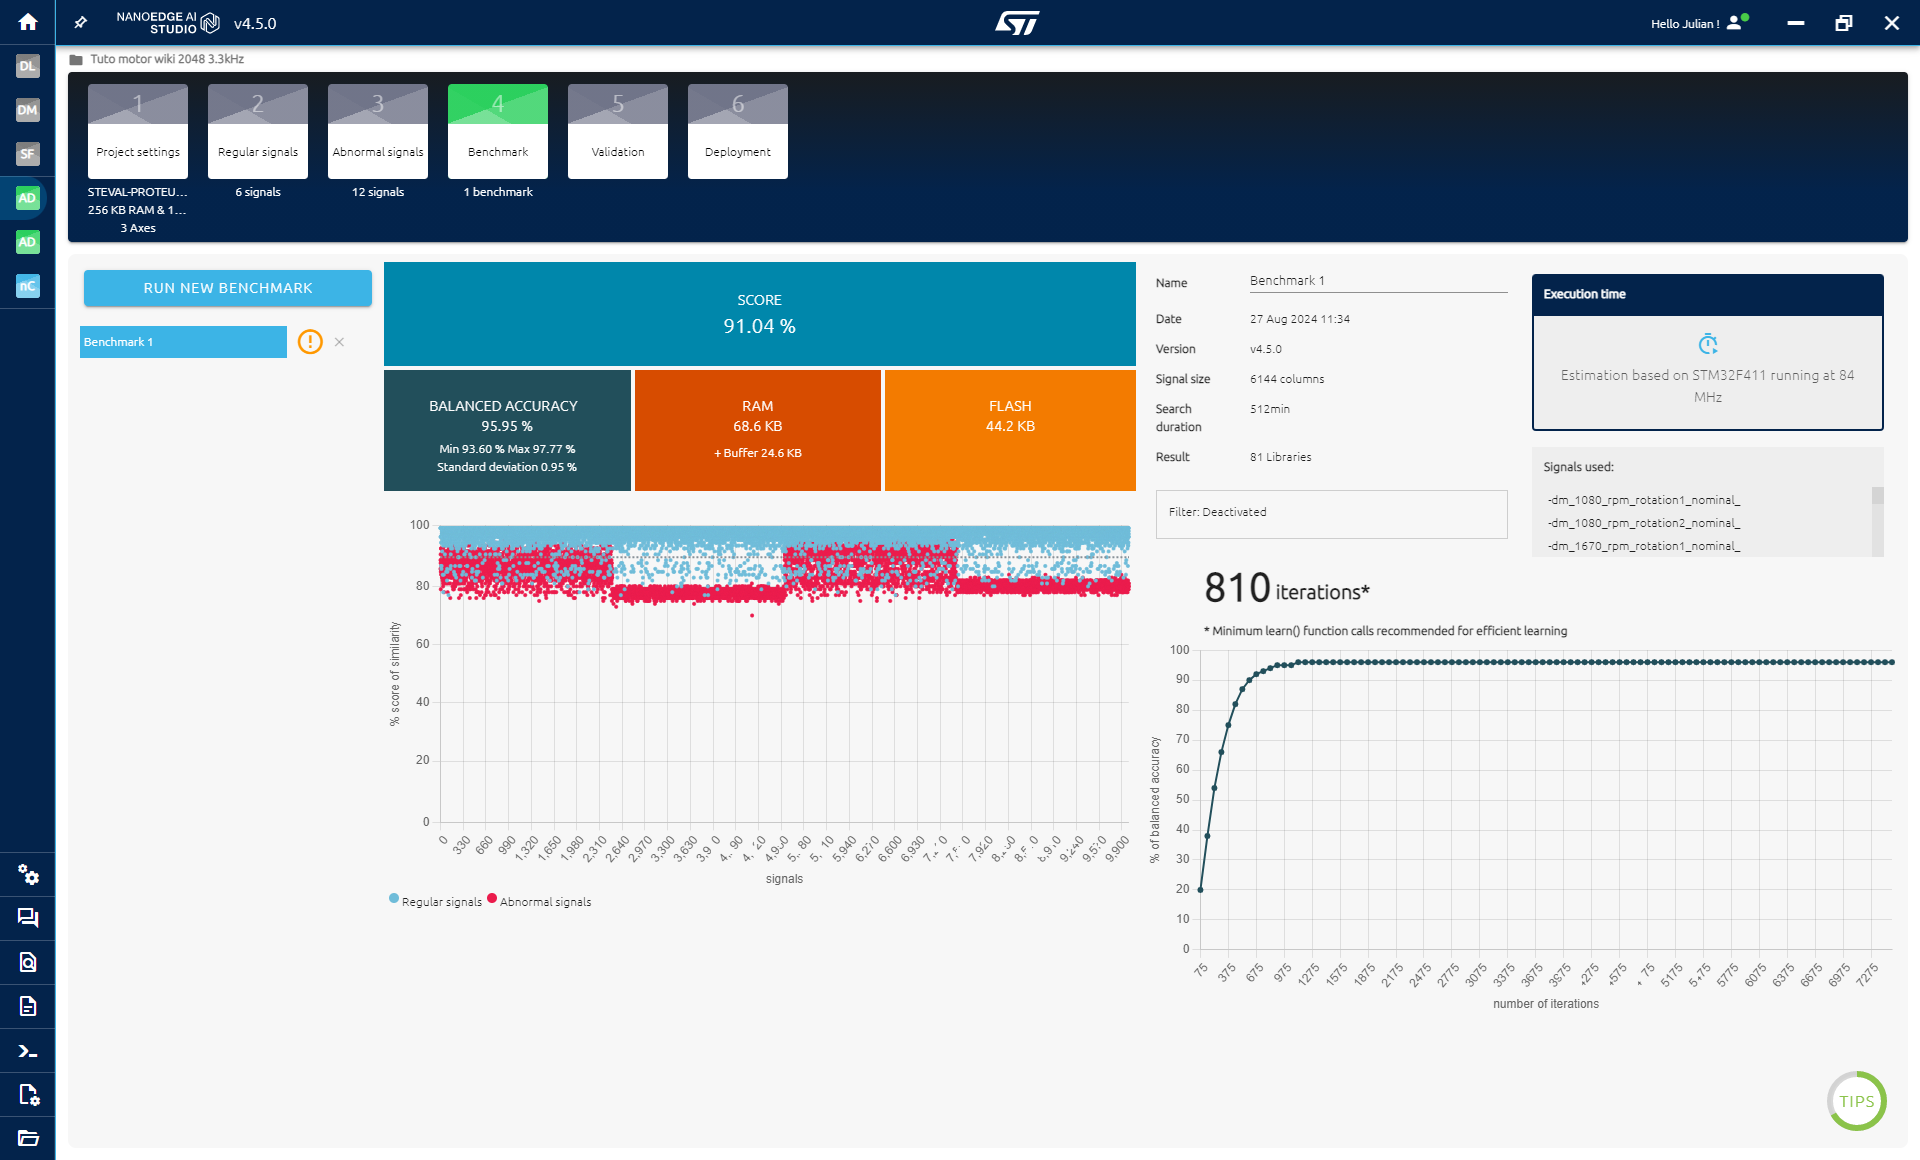
Here’s what NanoEdge achieved with the collected data in this case:
4.3.1. Result interpretation
Balanced accuracy
The mean balanced accuracy is 95.95%. During the benchmark, cross-validation is applied, splitting the data into 100 different training and test sets. The worst performance of the model is 93.6% balanced accuracy, while the best performance is 97.77%. Cross-validation helps avoid overfitting and provides an estimate of model performance on different data sets.
RAM and flash memory
- 68.6 Kbytes of RAM + 24.6 Kbytes required to store a buffer for inference.
- 44.2 Kbytes of flash memory.
We did not set a specific memory limit in the project settings, so these requirements are acceptable.
Plot
The important axis in the plot is the y-axis, which represents the percentage score of similarity. This metric indicates how similar a tested buffer is to the nominal data. A 100% similarity means the model considers the buffer to be completely similar to nominal data.
On the plot, blue, and red dots are shown:
- Blue dots represent nominal/regular buffers tested by the model.
- Red dots represent abnormal buffers tested by the model.
A perfect model would score 100% similarity for all blue dots and 0% similarity for all red dots.
4.4. Validation
The validation phase focuses on evaluating any "best library" identified during the benchmark. The goals of this phase are:
- Comparing the libraries on new datasets to ensure they did not overfit on the training data.
- Evaluating each library in detail.
- Using the test datasets; you can run an "experiment" to see how each library performs.
To run an experiment:
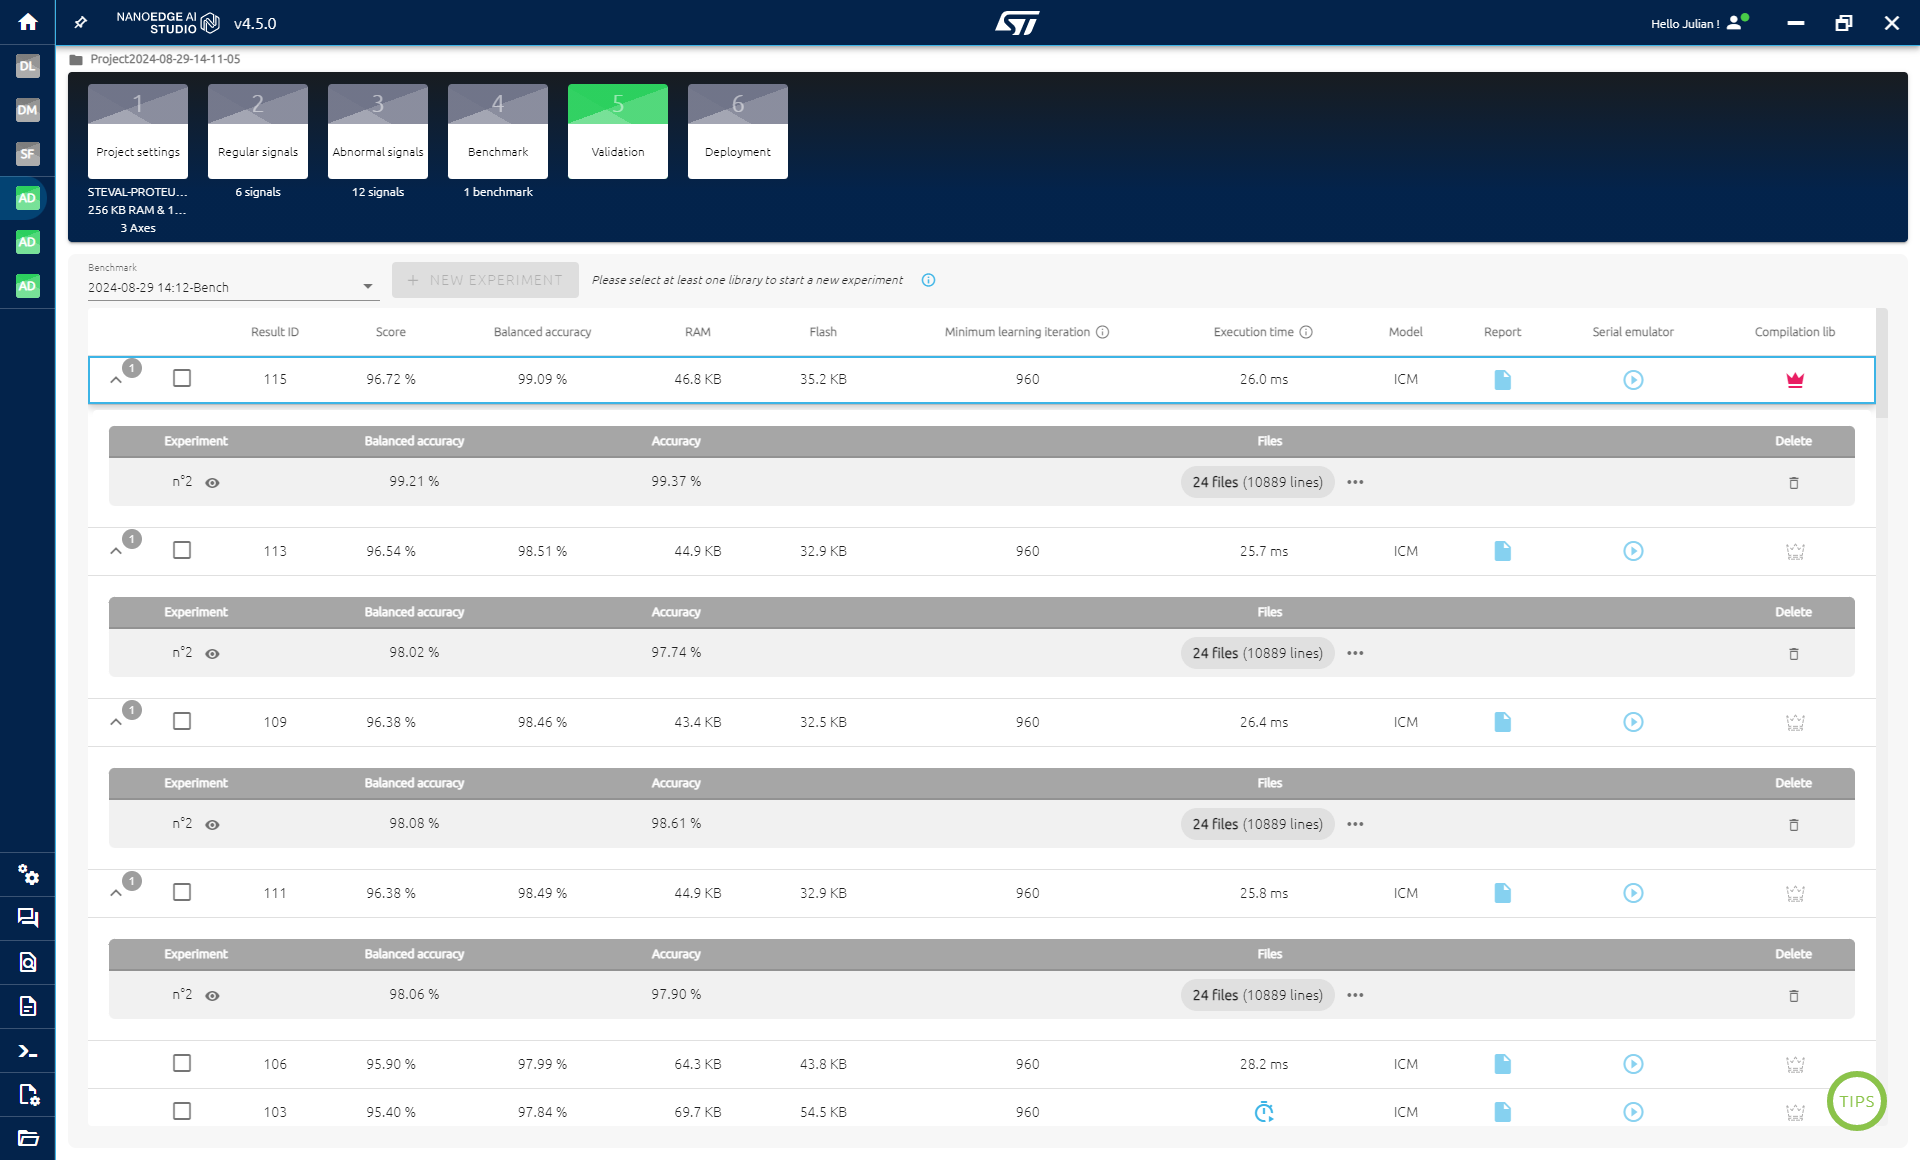
- Select up to 10 libraries to test and compare.
- Choose learning files, which in this case are the nominal training files.
- Choose nominal files and abnormal files for the test, using the test files you prepared.
- Click on Run Experiment.
As shown, in this case, all libraries performed well on the test files, with the first library delivering the best results. If some libraries perform poorly on the test files, it may indicate that you need more training data if you have limited data, or that the test data may not be similar to the training data. In such cases, consider mixing the training and test data, splitting it again, and retraining to see if performance improves.
Select the library that worked best on the test data.
Serial emulator
In the validation phase, you have the possiblity to also test a single library using serial. To do so, you need a data logger with the data rate and buffer size used in the project (use the data logger generator and program the code onto the Proteus board).
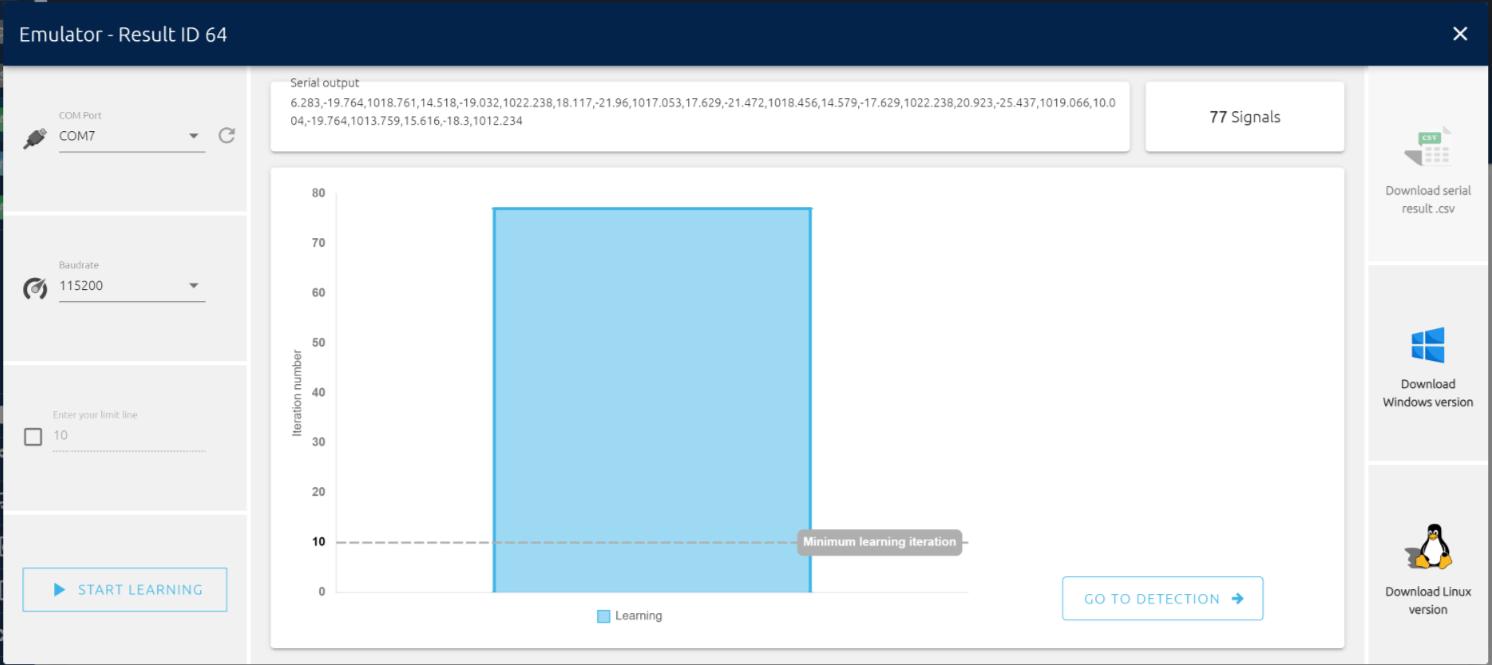
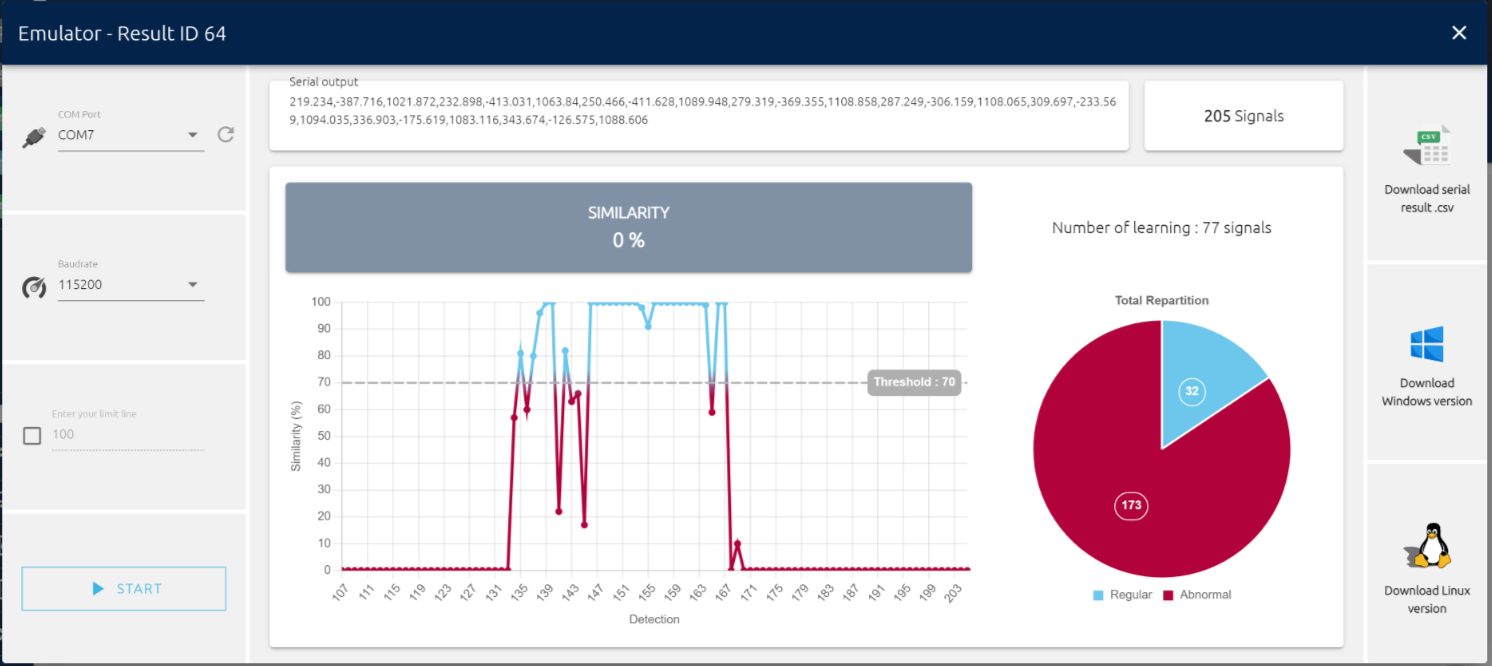
In anomaly detection, you can retrain a model directly on the microcontroller to improve its performance by learning its real environment. Because of that, the models in NanoEdge are privided "untrained". In the emulator, you first need to retrain the model by providing examples of nominal signals to test it on nominal and abnormal signals.
To use the serial emulator:
- Click on Serial Emulator for the library to test.
- Select the right COM Port
- Click Start learning
- You want to send nominal data only of the motor at all the speeds that you are working with.
- Execute learning until the Minimum learning iteration is reached
- Click on Go To Detection
Once the model has been retrained, you can test it by sending nominal or abnormal data and see if the model is able to recognize the correct classes.
4.5. Compilation
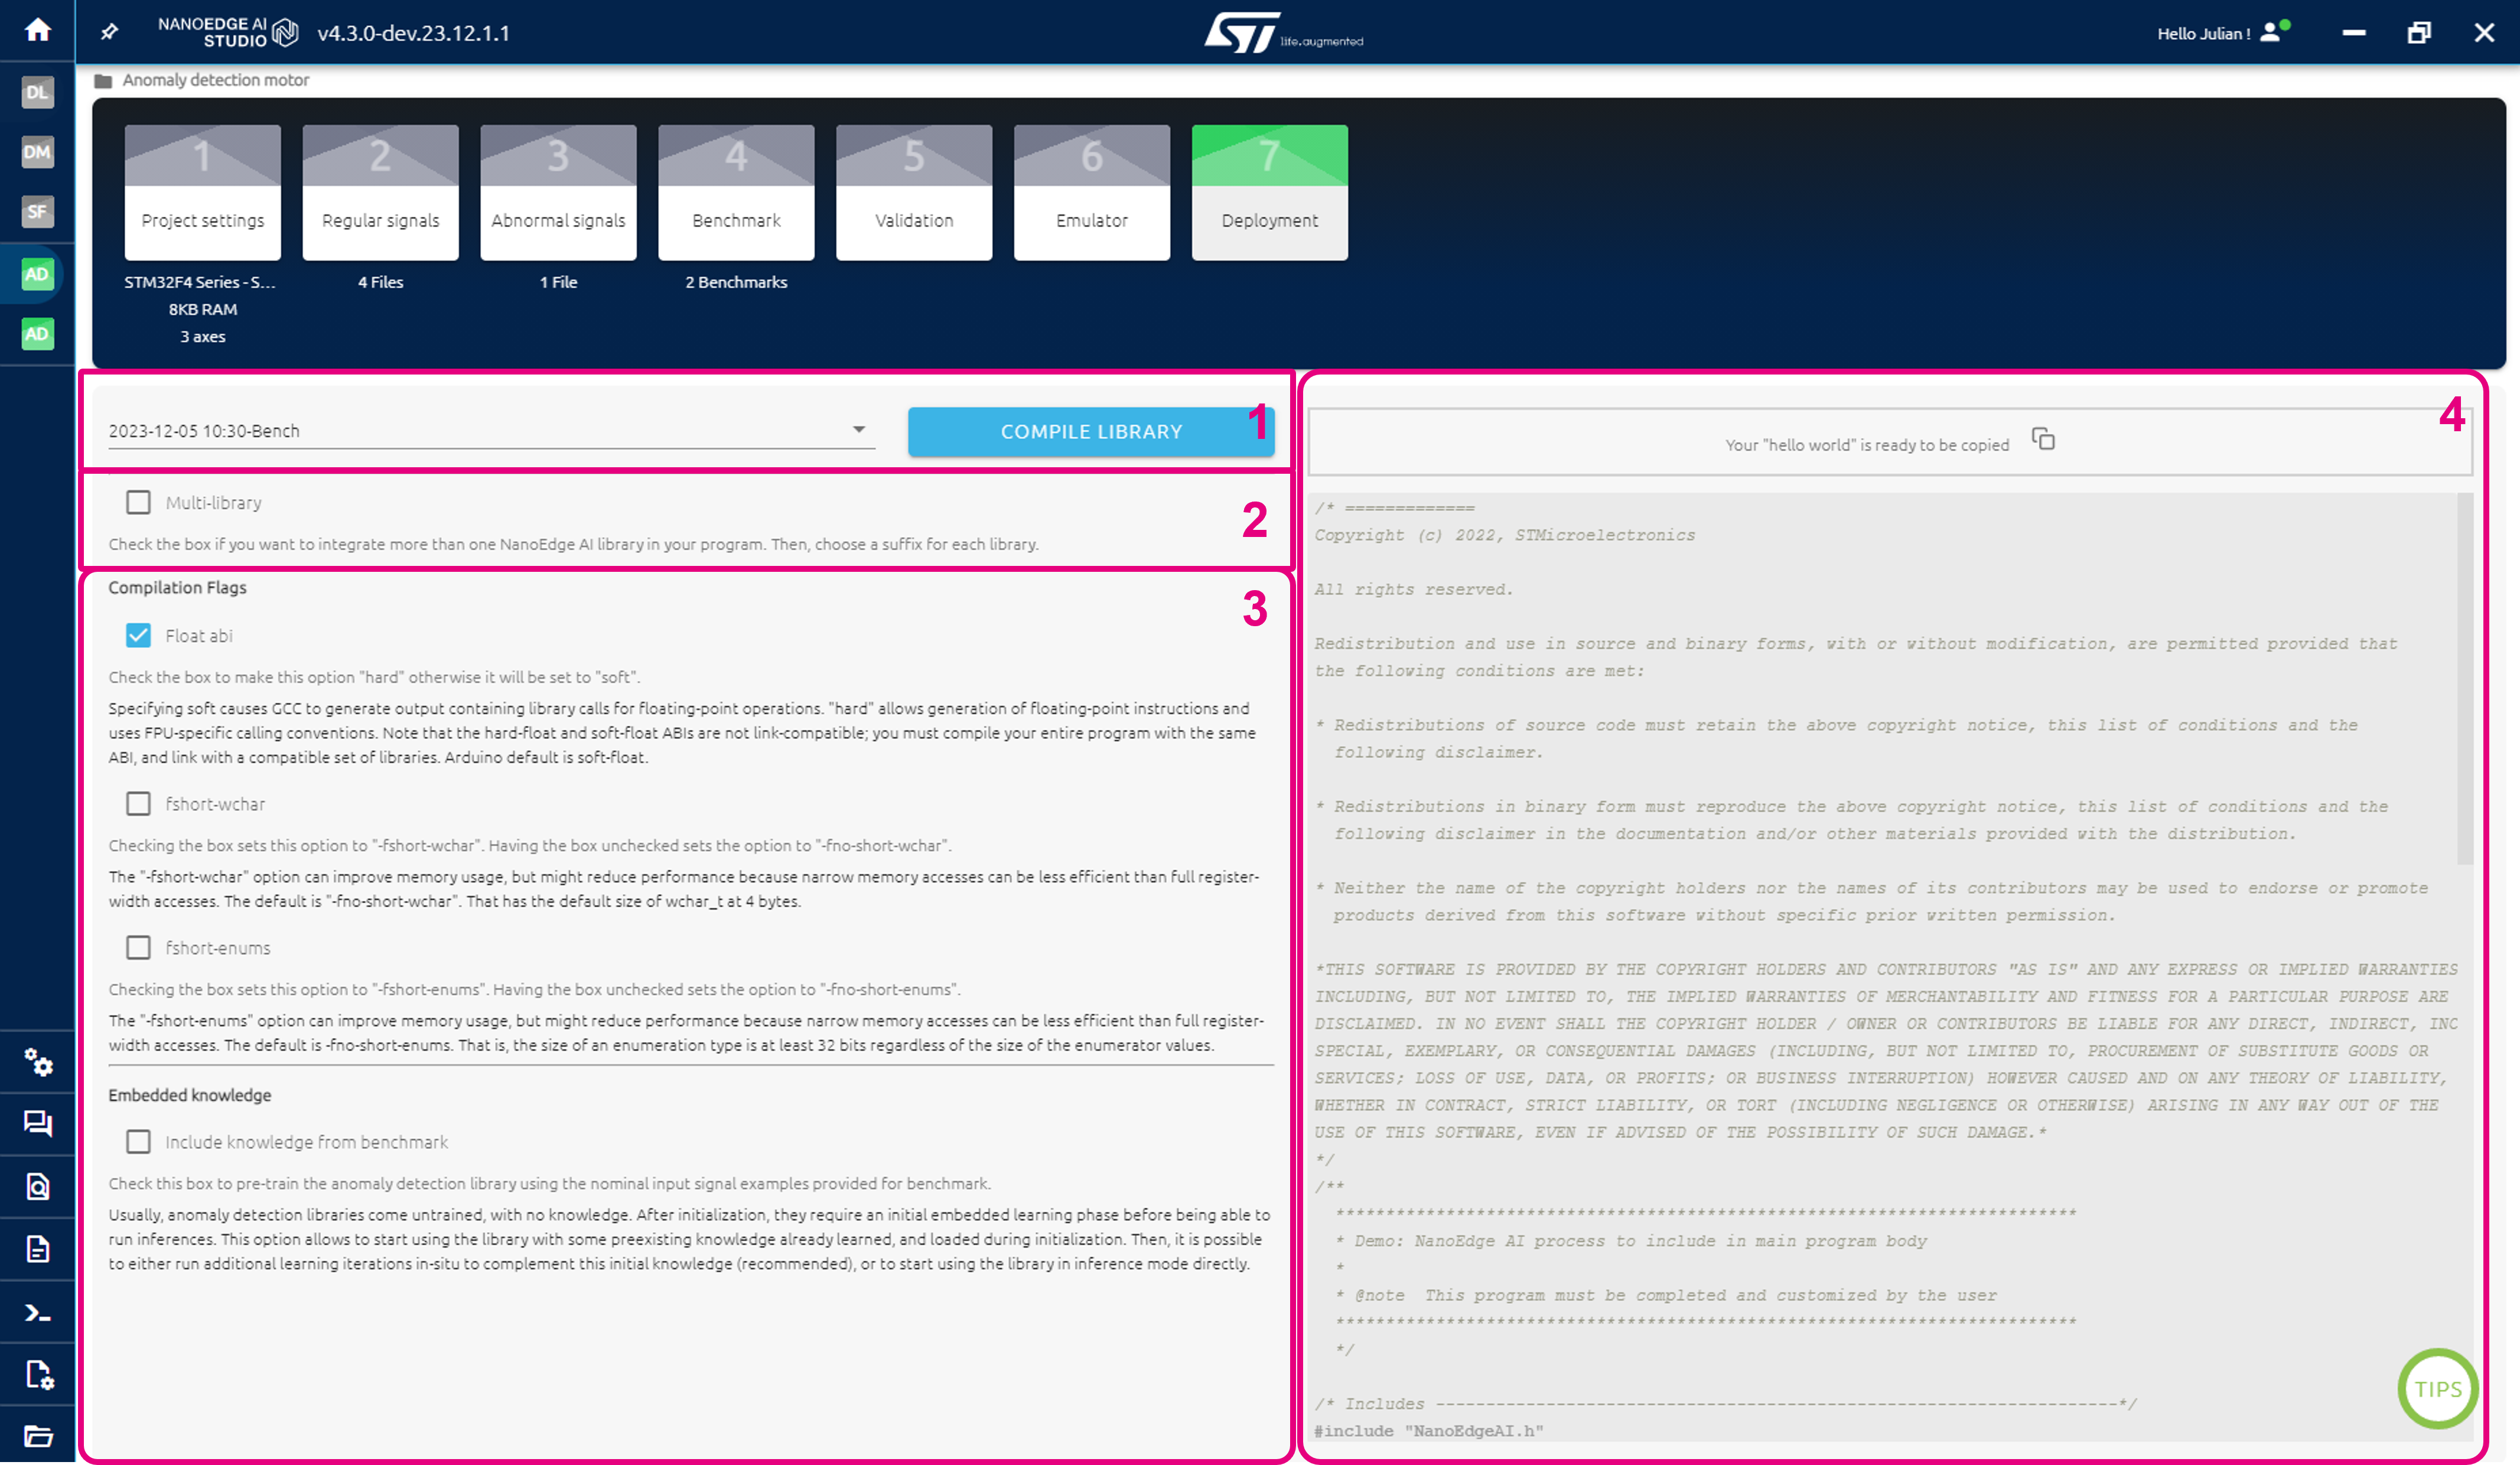
The deployment screen is intended for four main purposes:
- Select a benchmark and compile the associated library by clicking the COMPILE LIBRARY button.
- Optional: select multi-library, to deploy multiple libraries to the same MCU.
- Optional: select compilations flags to be considered during library compilation.
- Optional: copy a "Hello, World!" code example, to be used for inspiration.
5. Library integration
Now that the library's been selected, we need to create the code to use it. The general steps to follow are:
- Create a project in your preferred STM32 development environment, such as STM32CubeIDE.
- Import the library you obtained from NanoEdge AI Studio.
- Develop a function to retrieve data from your sensor and format it into buffers suitable for the AI library.
- Integrate the code specific to the AI library.
- Build your predictive maintenance application according to your requirements.
Instead of starting from scratch, you can use the publicly available source code of the NanoEdge AI Studio data logger. This code already includes much of the functionality needed, making it a convenient starting point.
5.1. Creating the project
First, get the data logger source code and clone it with the following command:
git clone https://github.com/stm32-hotspot/stm32ai-nanoedge-datalogger --recurse-submodulesOnce the code has been cloned:
- Go to
Projects/STEVAL-PROTEUS1/STEVAL-PROTEUS1_ISM330DHCX - Open
.cproject
You need SMT32CubeIDE for this.
On the left, look for:
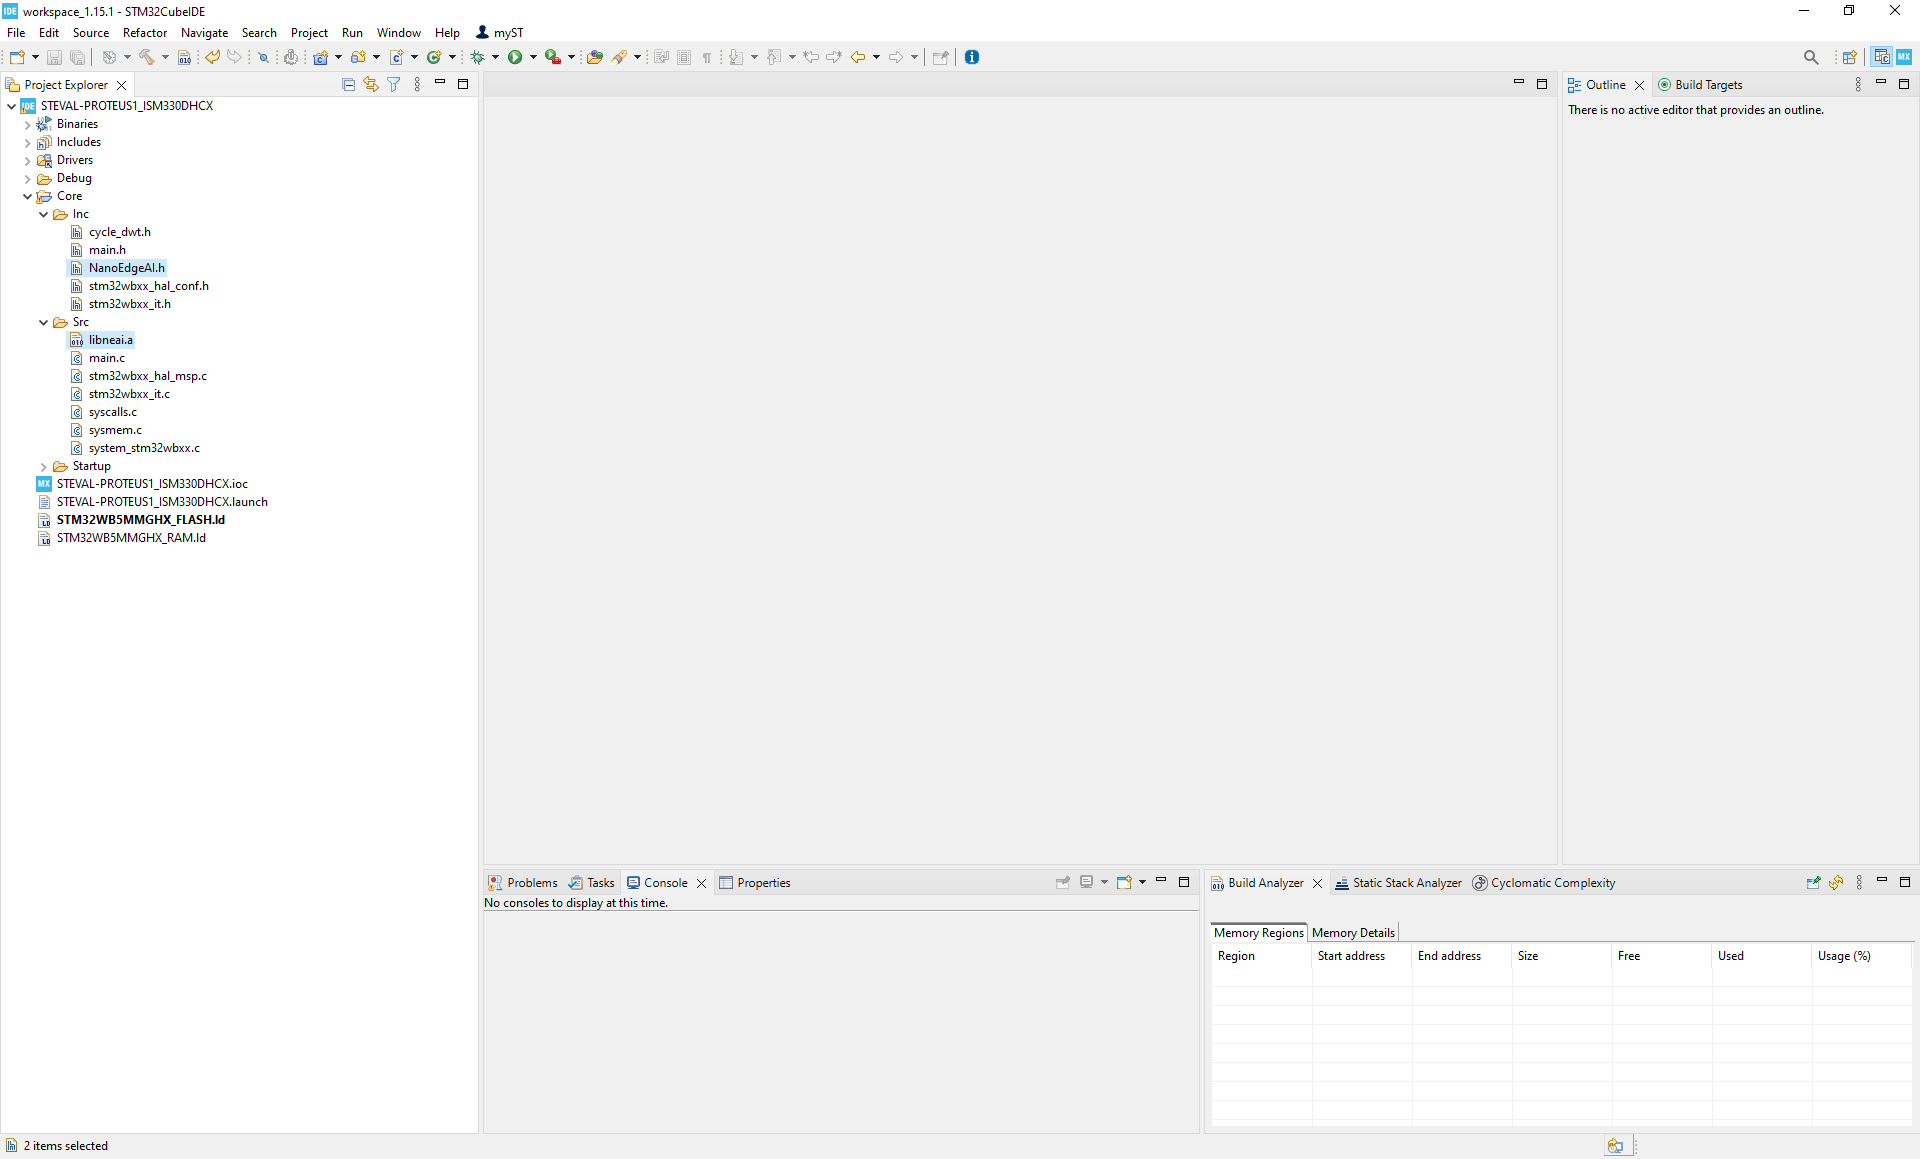
- NanoEdgeAI.h in
Core/Inc/ libneai.ainCore/Src
Replace them by the ones in the .zip files obtained in the compilation phase in NanoEdge.
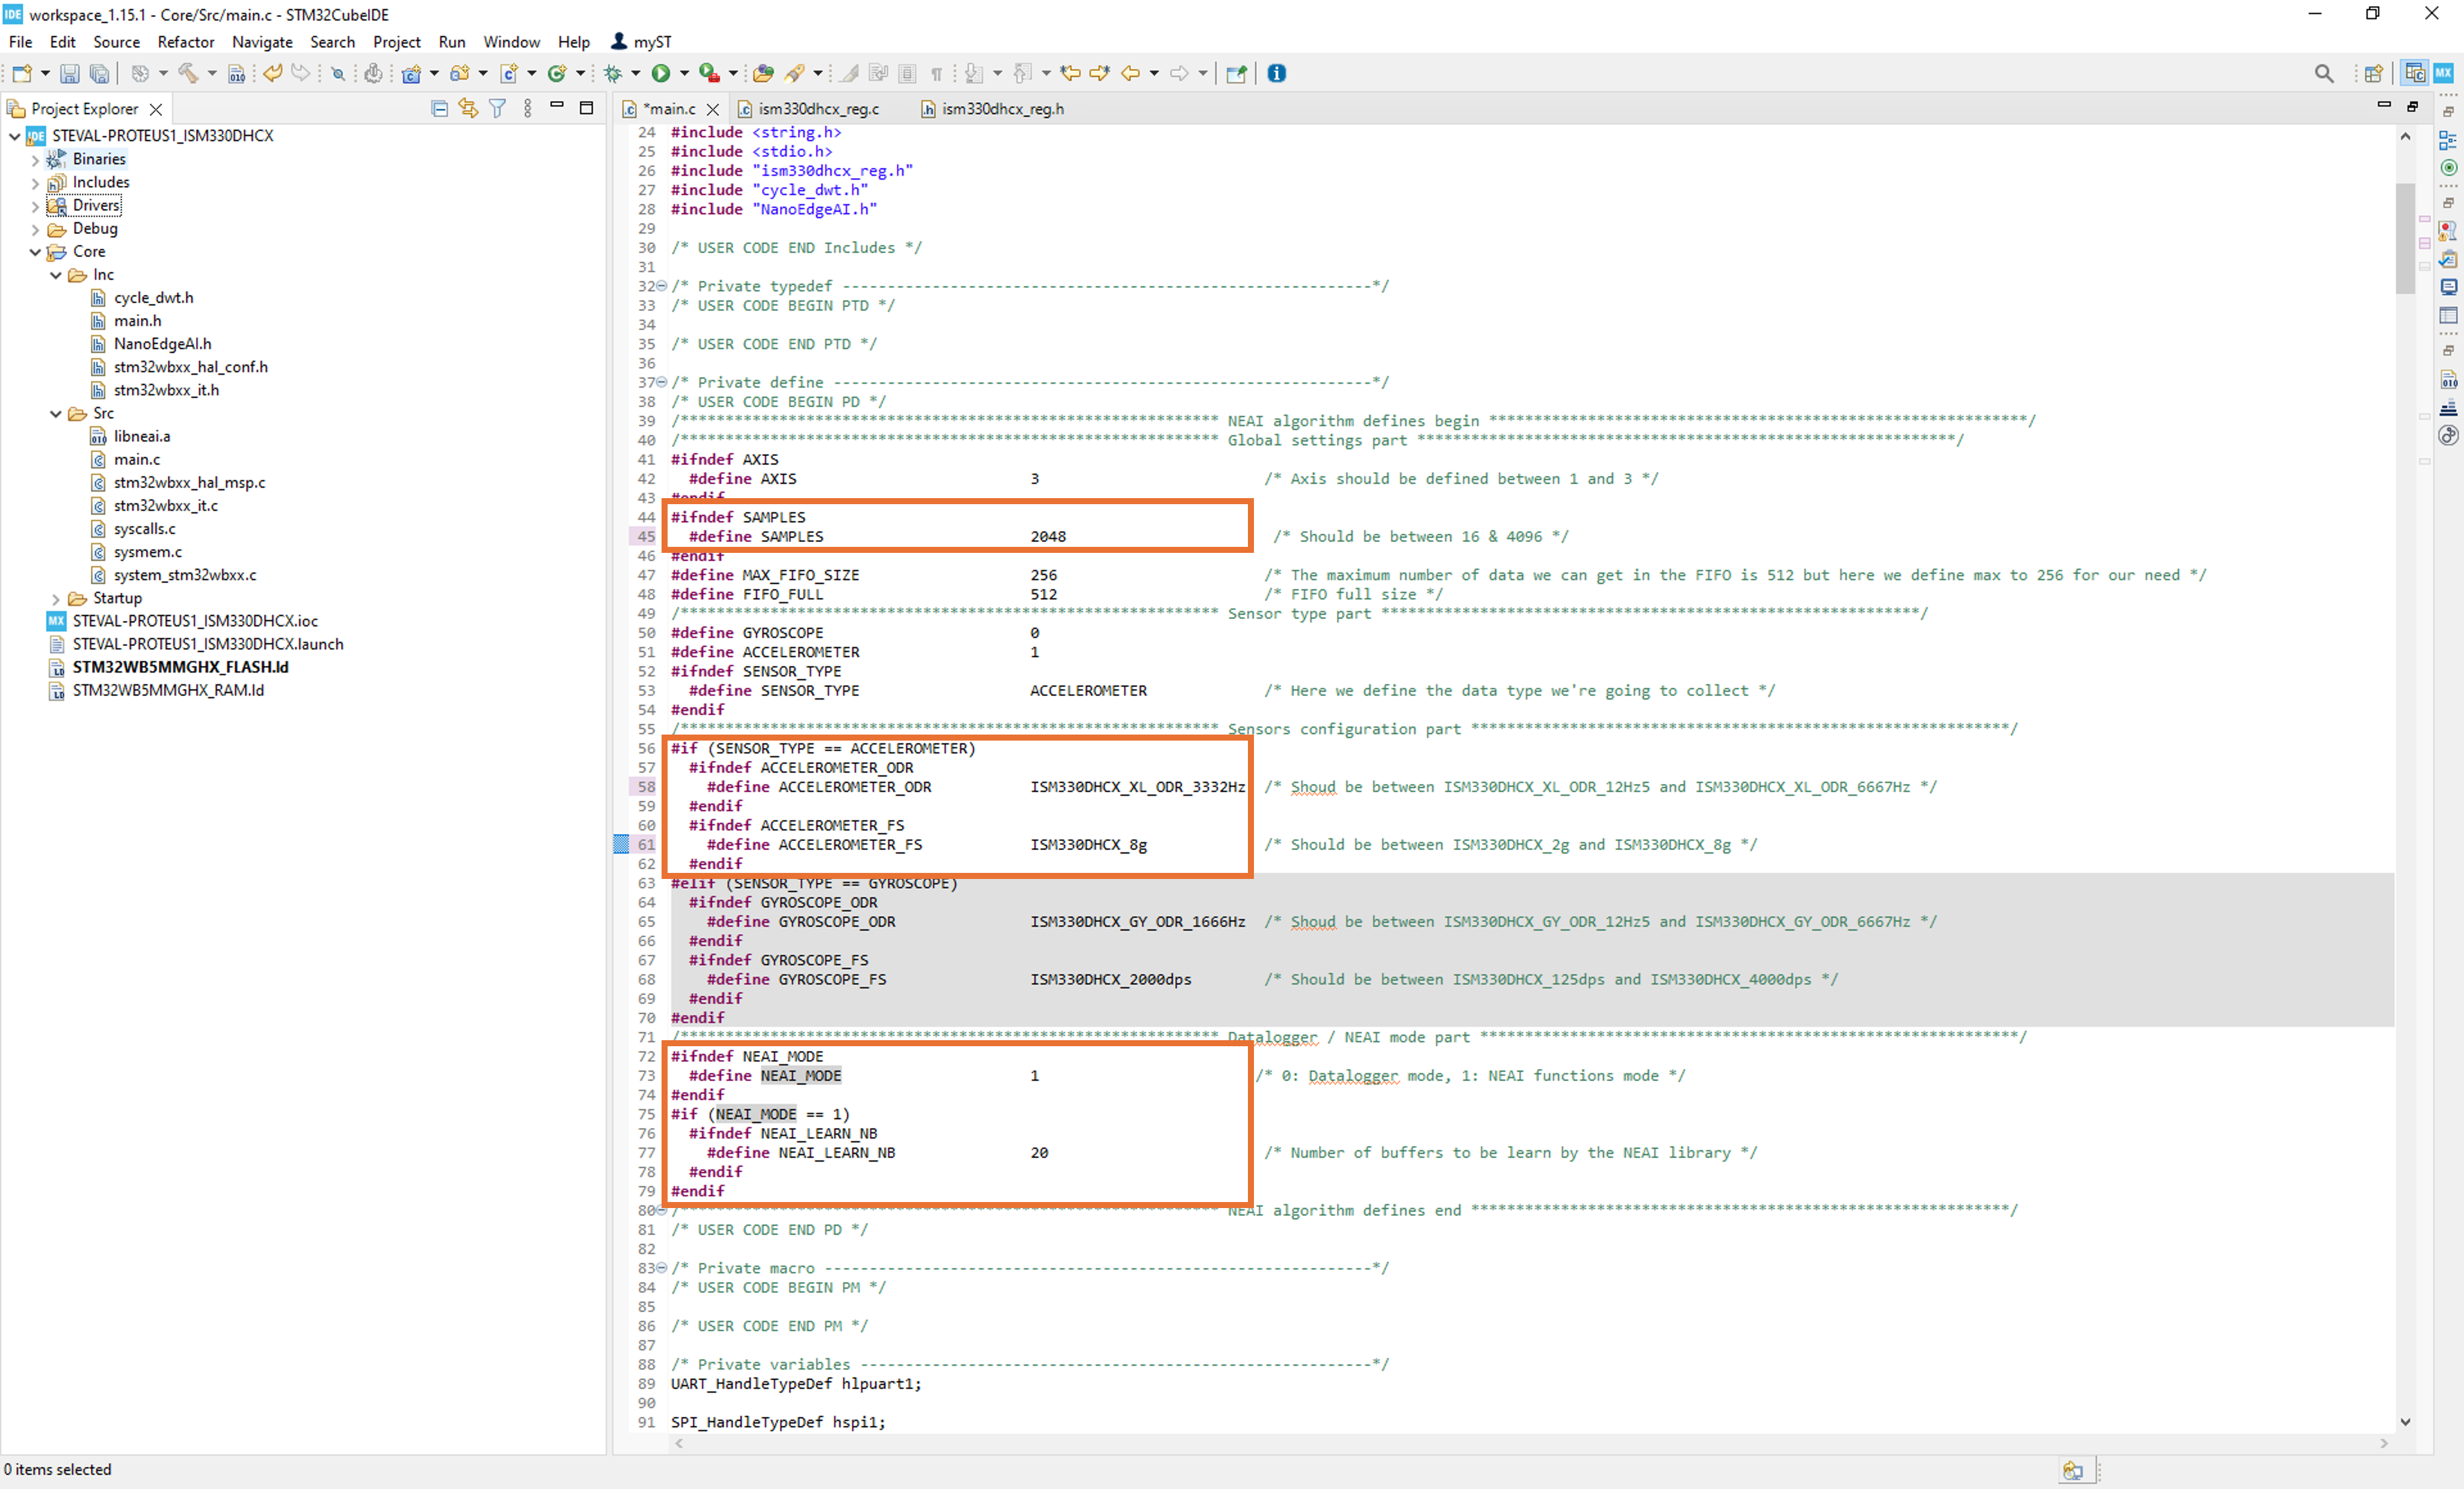
Then open main.c and change the parameters by the ones of your project:
- Change
SAMPLESto2048 - Change
ACCELEROMETER_ODRtoISM330DHCX_XL_ODR_3332Hz - Change
ACCELEROMETER_FStoISM330DHCX_8g - Change
NEAI_MODEto1(mode 0 is only for data logging, mode 1 calls the AI functions)
You can also changeNEAI_LEAN_NB to your preferences. By default, at least 10 learning samples are needed to use the library, but NanoEdge may recommend a higher number. Generally, starting with around 100 learning samples is a good approach.
5.2. Library functions
To add the AI functionality to your project, you need to make use of the provided functions. The idea is the following:
Initialize the library:
neai_anomalydetection_init(void)
This function is used to initialize the library. It needs to return NEAI_OK. If not, take a look at the anomaly detection library wiki page to solve the issue.
Retrain the model:
neai_anomalydetection_learn(float data_input[])
We're using anomaly detection, so we need to retrain the model before using it by giving it nominal data to learn as input. You want to lean at least 10 nominal signals and preferably the number of learning should correspond to the recommended one given in the benchmark or validation steps.
Perform anomaly detection:
neai_anomalydetection_detect(float data_input[], uint8_t *similarity)
After initialization and once the model has been retrained with nominal data, it can be used for inferences. For a buffer used as input, you will get a similarity score. It is up to the user to set a threshold to determine when to consider the buffer nominal or abnormal (generally set to 90%).
We can find the corresponding code in main.c:
Initialization:
  if (NEAI_MODE) {
    neai_state = neai_anomalydetection_init();
    printf("Initialize NEAI library. NEAI init return: %d.\n",  neai_state);
  }
Learn and detect:
#if NEAI_MODE
          uint32_t cycles_cnt = 0;
          if (neai_cnt < NEAI_LEARN_NB) {
            neai_cnt++;
            KIN1_ResetCycleCounter();
            neai_state = neai_anomalydetection_learn(neai_buffer);
            cycles_cnt = KIN1_GetCycleCounter();
            neai_time = (cycles_cnt * 1000000.0) / HAL_RCC_GetSysClockFreq();
            printf("Learn: %d / %d. NEAI learn return: %d. Cycles counter: %ld = %.1f µs at %ld Hz.\n",
                  neai_cnt, NEAI_LEARN_NB, neai_state, cycles_cnt, neai_time, HAL_RCC_GetSysClockFreq());
          }
          else {
            KIN1_ResetCycleCounter();
            neai_state = neai_anomalydetection_detect(neai_buffer, &neai_similarity);
            cycles_cnt = KIN1_GetCycleCounter();
            neai_time = (cycles_cnt * 1000000.0) / HAL_RCC_GetSysClockFreq();
            if (neai_similarity < 90) {
              HAL_GPIO_WritePin(LED_RED_GPIO_Port, LED_RED_Pin, GPIO_PIN_SET);
              HAL_GPIO_WritePin(LED_GREEN_GPIO_Port, LED_GREEN_Pin, GPIO_PIN_RESET);
            }
            else {
              HAL_GPIO_WritePin(LED_RED_GPIO_Port, LED_RED_Pin, GPIO_PIN_RESET);
              HAL_GPIO_WritePin(LED_GREEN_GPIO_Port, LED_GREEN_Pin, GPIO_PIN_SET);
            }
            printf("Similarity: %d / 100. NEAI detect return: %d. Cycles counter: %ld = %.1f µs at %ld Hz.\n",
                  neai_similarity, neai_state, cycles_cnt, neai_time, HAL_RCC_GetSysClockFreq());
          }
This part is in a while loop, and with every cycle a new buffer is collected from the accelerometer. If it has not reached the required number of learnings, another learning is executed. If it has, a detection is performed. If the similarity score is below 90%, it is considered abnormal and the LED light blinks red. If it is 90% or more, it is considered nominal and the LED light blinks green.
If something doesn't work, print the return of any of the functions. Getting anything other than NEAI_OK helps with debugging the code.

