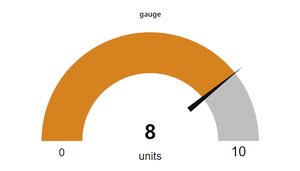
One of the great features of STM32CubeMonitor is the possibility to modify your dashboard with additional widgets. In the basic flow available when starting STM32CubeMonitor, the data rendering is done with the STMicrolectronics chart. The following explanations shows how to enrich this dashboard with the addition of a GAUGE.
1. Adding a filter after the processing node
All the data for all the variables is sent by the processing node during an acquisition. A gauge needs :
- only one variable
- low update frequency for graphical performance
- a specific data format.
All these constraints are solved by the "Single Value" node, which modifies the data sent by the processing "node" to fit the expectations of the "gauge" node.
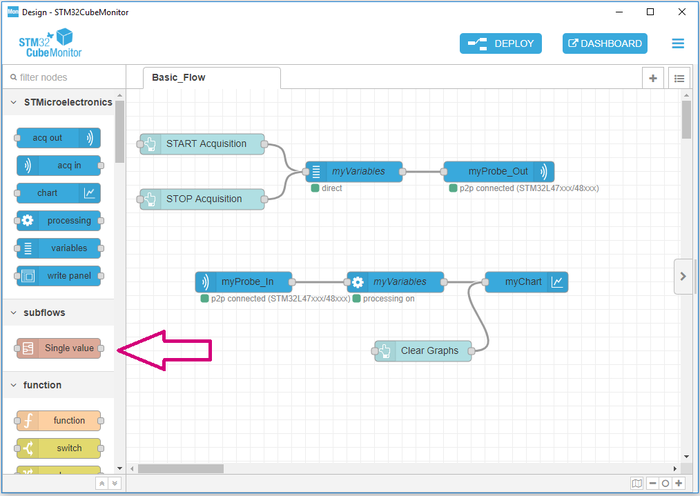
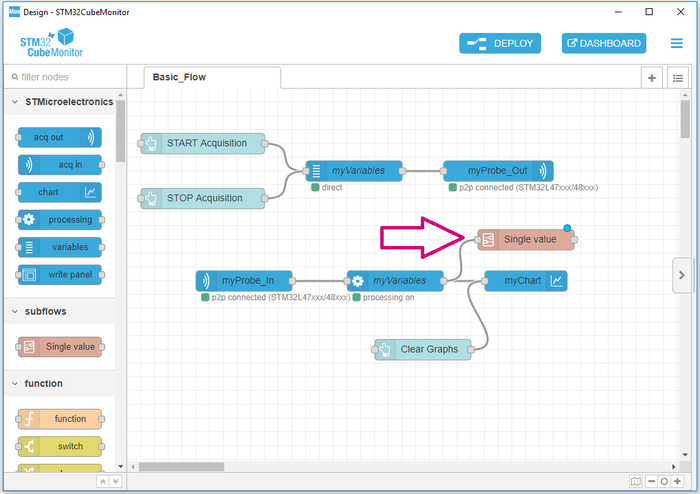
Drag and drop the single value node inside your flow and connect it to the processing node.
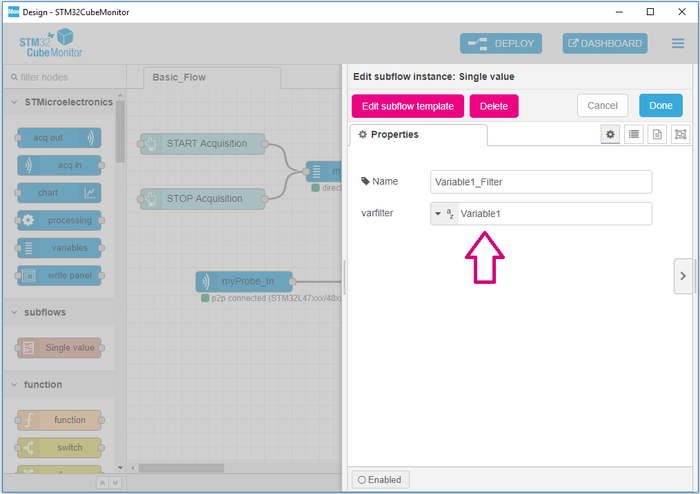
Open the single value node to select the name of the variable you want to monitor in the gauge.
After clicking on "Done", the "Single Value" node is configured.
2. Adding a gauge after the filter
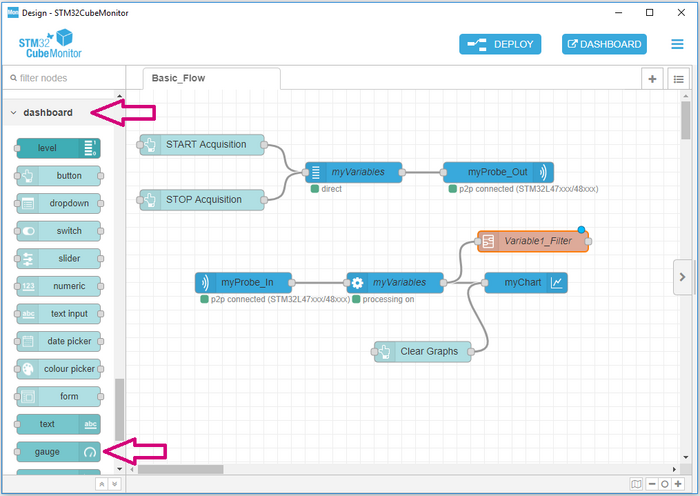
A "gauge" node is available in the section "dashboard" of the palette.
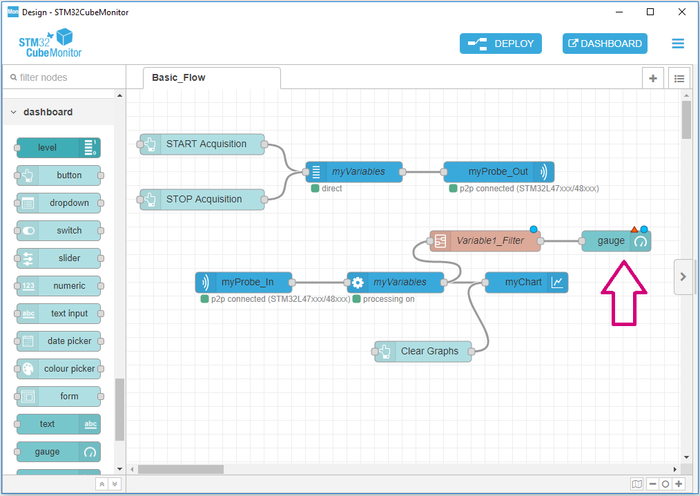
Drag and drop the gauge node inside your flow and connect it to the Variable1_Filter node.
Open the single value node to configure it :
- Label - title of the gauge in the dashboard
- Units - not mandatory
- Range
- Size of sectors - not mandatory
- Name of the node.
Deploying the flow to save the new configuration.
3. Start an acquisition
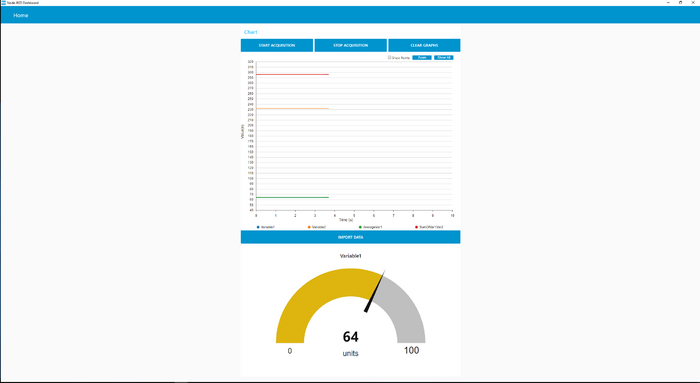
The gauge is now available in the dashboard and updated during acquisition. To modify the size and location of the gauge in the dashboard, please read STM32CubeMonitor:Design and dashboard modes.
