imported>Frq07399 mNo edit summary |
Registered User mNo edit summary Tag: 2017 source edit |
||
| (13 intermediate revisions by 4 users not shown) | |||
| Line 1: | Line 1: | ||
{{ApplicableFor | |||
{{ | |MPUs list=STM32MP13x, STM32MP15x, STM32MP25x | ||
|MPUs checklist=STM32MP13x, STM32MP15x, STM32MP25x | |||
}} | |||
<noinclude></noinclude> | |||
</noinclude> | |||
== Article purpose == | == Article purpose == | ||
| Line 17: | Line 14: | ||
| [[:Category:Tracing tools|Tracing tools]] | | [[:Category:Tracing tools|Tracing tools]] | ||
| style="text-align:left;" |'''trace-cmd'''<ref name=lwndotnet_tracecmd>https://lwn.net/Articles/410200/</ref> command interacts with the [[Ftrace]] tracer that is built inside the Linux kernel. It interfaces with the [[Ftrace]] specific files found in the debugfs file system under the tracing directory.<br> | | style="text-align:left;" |'''trace-cmd'''<ref name=lwndotnet_tracecmd>https://lwn.net/Articles/410200/</ref> command interacts with the [[Ftrace]] tracer that is built inside the Linux kernel. It interfaces with the [[Ftrace]] specific files found in the debugfs file system under the tracing directory.<br> | ||
'''kernelshark'''<ref name=homelinuxdotcom_kernelshark> | '''kernelshark'''<ref name=homelinuxdotcom_kernelshark>https://kernelshark.org/</ref> is a front-end reader of trace-cmd output. "trace-cmd record" and "trace-cmd extract" create a trace.dat (trace-cmd.dat) file. kernelshark can read this file, and produce a graph and list view of the corresponding data. | ||
| {{N}} || {{N}} || {{Y}} | | {{N}} || {{N}} || {{Y}} | ||
| | | {{N}} || {{N}} || {{N}} | ||
|- | |- | ||
</onlyinclude> | </onlyinclude> | ||
| Line 27: | Line 24: | ||
== Installing the trace and debug tool on your target board == | == Installing the trace and debug tool on your target board == | ||
=== Using the STM32MPU Embedded Software distribution === | === Using the STM32MPU Embedded Software distribution === | ||
Since Yocto | ====Distribution Package==== | ||
Since Yocto Kirstone version, '''trace-cmd''' recipe is present in meta-openembedded layer but not installed by default in all STM32MPU Software Packages. | |||
Following steps are proposed to integrate trace-cmd in STM32MPU Embedded Software distribution. | |||
* Add ''trace-cmd'' package install to the st-image-weston image: | * Add ''trace-cmd'' package install to the st-image-weston image: | ||
{{PC$}} echo ' | {{PC$}}echo 'IMAGE_INSTALL:append += "trace-cmd"' >> layers/meta-st/meta-st-openstlinux/recipes-st/images/st-image-weston.bbappend | ||
* Rebuilt the ''st-image-weston'' target: | * Rebuilt the ''st-image-weston'' target: | ||
{{PC$}} cd {{ | {{PC$}}cd {{HighlightParam|''<build_directory>''}} | ||
{{PC$}} bitbake st-image-weston | {{PC$}}bitbake st-image-weston | ||
When testing the new image on the target board, trace-cmd can be found in the following path: | When testing the new image on the target board, trace-cmd can be found in the following path: | ||
{{Board$}} which trace-cmd | {{Board$}}which trace-cmd | ||
/usr/bin/trace-cmd | /usr/bin/trace-cmd | ||
{{highlight|However, an additional configuration of the Linux kernel must be performed to obtain the trace.}} | {{highlight|However, an additional configuration of the Linux kernel must be performed to obtain the trace.}} | ||
| Line 100: | Line 45: | ||
{{highlight|This is the reason why you can not use this tool in Starter and Developer Packages context.}} | {{highlight|This is the reason why you can not use this tool in Starter and Developer Packages context.}} | ||
== Getting started == | == Getting started == | ||
| Line 112: | Line 54: | ||
You first need to mount the tracefs: | You first need to mount the tracefs: | ||
{{Board$}} mount -t tracefs nodev /sys/kernel/tracing | {{Board$}}mount -t tracefs nodev /sys/kernel/tracing | ||
To find out which tracers are available, simply cat the available_tracers file in the tracing directory: | To find out which tracers are available, simply cat the available_tracers file in the tracing directory: | ||
{{Board$}} cat /sys/kernel/tracing/available_tracers | {{Board$}}cat /sys/kernel/tracing/available_tracers | ||
function_graph function nop | function_graph function nop | ||
| Line 125: | Line 67: | ||
:- To get a trace on UART, you can connect to the target board with the new console (i.e. through ssh), and then type a simple command, like "''ls''" | :- To get a trace on UART, you can connect to the target board with the new console (i.e. through ssh), and then type a simple command, like "''ls''" | ||
:- Then press Ctrl-C to stop the trace | :- Then press Ctrl-C to stop the trace | ||
{{Board$}} trace-cmd record -p {{green|function}} -l {{ | {{Board$}}trace-cmd record -p {{green|function}} -l {{HighlightParam|''*uart*''}} | ||
plugin '{{green|function}}' | plugin '{{green|function}}' | ||
Hit Ctrl^C to stop recording | Hit Ctrl^C to stop recording | ||
| Line 139: | Line 81: | ||
:- To get trace on UART, you can connect to the target board with the new console (i.e. through ssh), and then type a simple command, like "''ls''" | :- To get trace on UART, you can connect to the target board with the new console (i.e. through ssh), and then type a simple command, like "''ls''" | ||
:- Then press Ctrl-C to stop the trace | :- Then press Ctrl-C to stop the trace | ||
{{Board$}} trace-cmd record -p {{green|function_graph}} -l {{ | {{Board$}}trace-cmd record -p {{green|function_graph}} -l {{HighlightParam|''*uart*''}} | ||
plugin '{{green|function_graph}}' | plugin '{{green|function_graph}}' | ||
Hit Ctrl^C to stop recording | Hit Ctrl^C to stop recording | ||
| Line 151: | Line 93: | ||
=== Reading the trace === | === Reading the trace === | ||
Command to read the trace: | Command to read the trace: | ||
{{Board$}} trace-cmd report | {{Board$}}trace-cmd report | ||
By default, it reads the previously created file ''trace.dat'' at the position where the command is entered. | By default, it reads the previously created file ''trace.dat'' at the position where the command is entered. | ||
If you want to specify an other file name: | If you want to specify an other file name: | ||
{{Board$}} trace-cmd report -i {{ | {{Board$}}trace-cmd report -i {{HighlightParam|''mytrace.dat''}} | ||
or | or | ||
{{Board$}} trace-cmd report {{ | {{Board$}}trace-cmd report {{HighlightParam|''mytrace.dat''}} | ||
== To go further == | == To go further == | ||
=== Visualizing trace using kernelshark === | === Visualizing trace using kernelshark === | ||
==== Host installation (Linux environment) ==== | ==== Host installation (Linux environment) ==== | ||
{{PC$}} sudo apt-get install kernelshark | {{PC$}}sudo apt-get install kernelshark | ||
==== Opening and reading trace-cmd trace ==== | ==== Opening and reading trace-cmd trace ==== | ||
kernelshark can read trace-cmd report and produce a graph and list view of the data. Please refer to kernelshark home page<ref name=homelinuxdotcom_kernelshark/> for detail. | kernelshark can read trace-cmd report and produce a graph and list view of the data. Please refer to kernelshark home page<ref name=homelinuxdotcom_kernelshark/> for detail. | ||
* Get the trace from the board. It is possible to get the trace directly from the SDCard under use, or remotely from the target board: | * Get the trace from the board. It is possible to get the trace directly from the SDCard under use, or remotely from the target board: | ||
{{PC$}} scp root@{{ | {{PC$}}scp root@{{HighlightParam|<''board_ip_address''>/<''path_to''>}}/trace.dat {{HighlightParam|<''path_on_host''>}} | ||
* Open trace with kernelshark | * Open trace with kernelshark | ||
It can be done by opening kernelshark and then opening trace.dat file from the menu, or using the following command: | It can be done by opening kernelshark and then opening trace.dat file from the menu, or using the following command: | ||
{{PC$}} kernelshark {{ | {{PC$}}kernelshark {{HighlightParam|<''path_on_host''>}}/trace.dat | ||
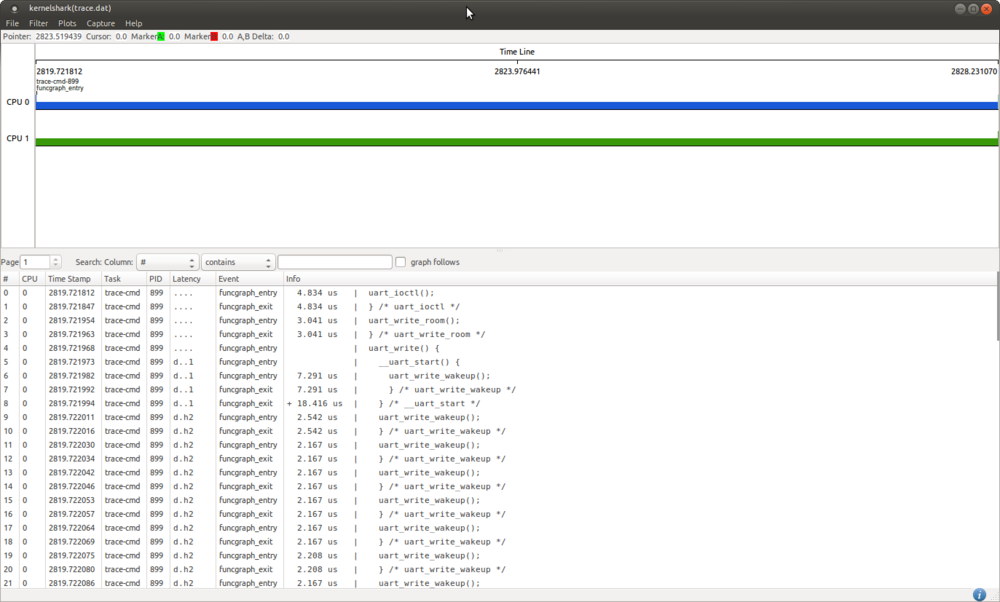
Here is the example of a trace filtered with UART function_graph mode:<br /> | Here is the example of a trace filtered with UART function_graph mode:<br /> | ||
[[File:Kernelshark functiongraph.png|1000px|link=]] | [[File:Kernelshark functiongraph.png|1000px|link=]] | ||
| Line 197: | Line 139: | ||
| https://elinux.org | | https://elinux.org | ||
|} | |} | ||
<noinclude> | |||
{{ ArticleBasedOnModel | Trace and debug tools article model }} | |||
{{ PublicationRequestId | 9570 | 14Nov'18 }} | |||
[[Category:Linux tracing tools]] | |||
</noinclude> | |||
Latest revision as of 16:17, 14 June 2024
1. Article purpose[edit | edit source]
This article provides the basic information needed to start using the Linux tool: trace-cmd[1] and host trace viewer kernelshark[2].
2. Introduction[edit | edit source]
The following table provides a brief description of the tool, as well as its availability depending on the software packages:
![]() : this tool is either present (ready to use or to be activated), or can be integrated and activated on the software package.
: this tool is either present (ready to use or to be activated), or can be integrated and activated on the software package.
![]() : this tool is not present and cannot be integrated, or it is present but cannot be activated on the software package.
: this tool is not present and cannot be integrated, or it is present but cannot be activated on the software package.
| Tool | STM32MPU Embedded Software distribution | STM32MPU Embedded Software distribution for Android™ | ||||||
|---|---|---|---|---|---|---|---|---|
| Name | Category | Purpose | Starter Package | Developer Package | Distribution Package | Starter Package | Developer Package | Distribution Package |
| trace-cmd | Tracing tools | trace-cmd[1] command interacts with the Ftrace tracer that is built inside the Linux kernel. It interfaces with the Ftrace specific files found in the debugfs file system under the tracing directory. kernelshark[2] is a front-end reader of trace-cmd output. "trace-cmd record" and "trace-cmd extract" create a trace.dat (trace-cmd.dat) file. kernelshark can read this file, and produce a graph and list view of the corresponding data. |
||||||
Note: in case you want to trace at boot time, it is recommended to use ftrace.
3. Installing the trace and debug tool on your target board[edit | edit source]
3.1. Using the STM32MPU Embedded Software distribution[edit | edit source]
3.1.1. Distribution Package[edit | edit source]
Since Yocto Kirstone version, trace-cmd recipe is present in meta-openembedded layer but not installed by default in all STM32MPU Software Packages.
Following steps are proposed to integrate trace-cmd in STM32MPU Embedded Software distribution.
- Add trace-cmd package install to the st-image-weston image:
echo 'IMAGE_INSTALL:append += "trace-cmd"' >> layers/meta-st/meta-st-openstlinux/recipes-st/images/st-image-weston.bbappend
- Rebuilt the st-image-weston target:
cd <build_directory>
bitbake st-image-weston
When testing the new image on the target board, trace-cmd can be found in the following path:
which trace-cmd
/usr/bin/trace-cmd
However, an additional configuration of the Linux kernel must be performed to obtain the trace.
This is the configuration used for ftrace. Please refer to Ftrace install to complete the configuration of the Linux kernel.
This is the reason why you can not use this tool in Starter and Developer Packages context.
4. Getting started[edit | edit source]
trace-cmd inherits all available configurations from Ftrace.
It is possible to get filtered trace with both function and graph function mode.
It is also possible to trace specific prints done in the source file.
You first need to mount the tracefs:
mount -t tracefs nodev /sys/kernel/tracing
To find out which tracers are available, simply cat the available_tracers file in the tracing directory:
 cat /sys/kernel/tracing/available_tracers
 function_graph function nop
Note that you must be placed on the target board within a directory path where you have access rights for writing the generated trace file.
4.1. Making a trace using function tracer mode[edit | edit source]
The example below shows how to filter on a set of functions that contains uart:
- - To get a trace on UART, you can connect to the target board with the new console (i.e. through ssh), and then type a simple command, like "ls"
- - Then press Ctrl-C to stop the trace
trace-cmd record -p function -l *uart*
  plugin 'function'
Hit Ctrl^C to stop recording
^CCPU0 data recorded at offset=0x15d000
    4096 bytes in size
CPU1 data recorded at offset=0x15e000
    4096 bytes in size
See below for reading the trace.
4.2. Making a trace using graph function tracer mode[edit | edit source]
The example below shows how to filter on a set of graph functions that contains uart:
- - To get trace on UART, you can connect to the target board with the new console (i.e. through ssh), and then type a simple command, like "ls"
- - Then press Ctrl-C to stop the trace
trace-cmd record -p function_graph -l *uart*
  plugin 'function_graph'
Hit Ctrl^C to stop recording
^CCPU0 data recorded at offset=0x15d000
    4096 bytes in size
CPU1 data recorded at offset=0x15e000
    4096 bytes in size
See below for reading the trace.
4.3. Reading the trace[edit | edit source]
Command to read the trace:
trace-cmd report
By default, it reads the previously created file trace.dat at the position where the command is entered.
If you want to specify an other file name:
trace-cmd report -i mytrace.dat
or
trace-cmd report mytrace.dat
5. To go further[edit | edit source]
5.1. Visualizing trace using kernelshark[edit | edit source]
5.1.1. Host installation (Linux environment)[edit | edit source]
sudo apt-get install kernelshark
5.1.2. Opening and reading trace-cmd trace[edit | edit source]
kernelshark can read trace-cmd report and produce a graph and list view of the data. Please refer to kernelshark home page[2] for detail.
- Get the trace from the board. It is possible to get the trace directly from the SDCard under use, or remotely from the target board:
scp root@<board_ip_address>/<path_to>/trace.dat <path_on_host>
- Open trace with kernelshark
It can be done by opening kernelshark and then opening trace.dat file from the menu, or using the following command:
kernelshark <path_on_host>/trace.dat
Here is the example of a trace filtered with UART function_graph mode:
6. References[edit | edit source]
- Useful external links
| Document link | Document Type | Description |
|---|---|---|
| Using KernelShark | User Guide | https://lwn.net |
| Trace-cmd presentation | User Guide | https://lwn.net |
| KernelShark quick tutorial | Presentation | https://elinux.org |