1. Article purpose[edit source]
This article provides the basic information needed to start using the Linux kernel tool: sysprof[1].
2. Introduction[edit source]
The following table provides a brief description of the tool, as well as its availability depending on the software packages:
![]() : this tool is either present (ready to use or to be activated), or can be integrated and activated on the software package.
: this tool is either present (ready to use or to be activated), or can be integrated and activated on the software package.
![]() : this tool is not present and cannot be integrated, or it is present but cannot be activated on the software package.
: this tool is not present and cannot be integrated, or it is present but cannot be activated on the software package.
| Tool | STM32MPU Embedded Software distribution | STM32MPU Embedded Software distribution for Android™ | ||||||
|---|---|---|---|---|---|---|---|---|
| Name | Category | Purpose | Starter Package | Developer Package | Distribution Package | Starter Package | Developer Package | Distribution Package |
| sysprof | Monitoring tools | sysprof[1] is a statistical, system-wide profiler for Linux. It helps in finding the functions in which a program spends most of its time. sysprof proposes a user interface available directly on the board display screen. |
||||||
3. Installing the trace and debug tool on your target board[edit source]
3.1. Using STM32MPU Embedded Software distribution[edit source]
sysprof is installed by default and ready to be used with all STM32MPU Embedded Software Packages.
 which sysprof
/usr/bin/sysprof
Sysprof is integrated in weston image distribution through openembedded-core package: openembedded-core/meta/recipes-core/packagegroups/packagegroup-core-tools-profile.bb.
PROFILE_TOOLS_X = "${@bb.utils.contains('DISTRO_FEATURES', 'x11', 'sysprof', , d)}"
...
RRECOMMENDS_${PN} = "\
   ${PERF} \
   trace-cmd \
   blktrace \
   ${PROFILE_TOOLS_X} \
   ${PROFILE_TOOLS_SYSTEMD} \
   "
4. Getting started[edit source]
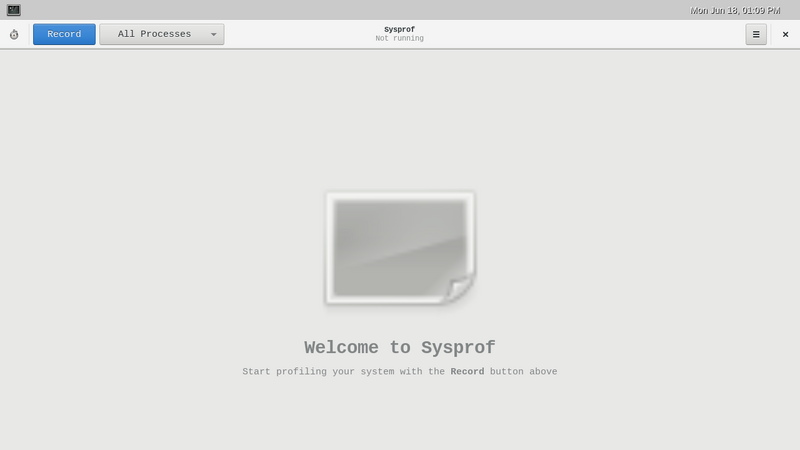
- Starting sysprof on the board: Need to specify the display to be used, for example:
sysprof --display=/run/user/1000/wayland-1
- Sysprof proposes a User interface through the board X interface to the display. It might be more convenient to plug a mouse (and optionally a keyboard) to use the tool interface.

- Recording
- Clicking on the top left Record button launches the recording. Recording is stopped by clicking on the top left Stop button (that replaces the record button).
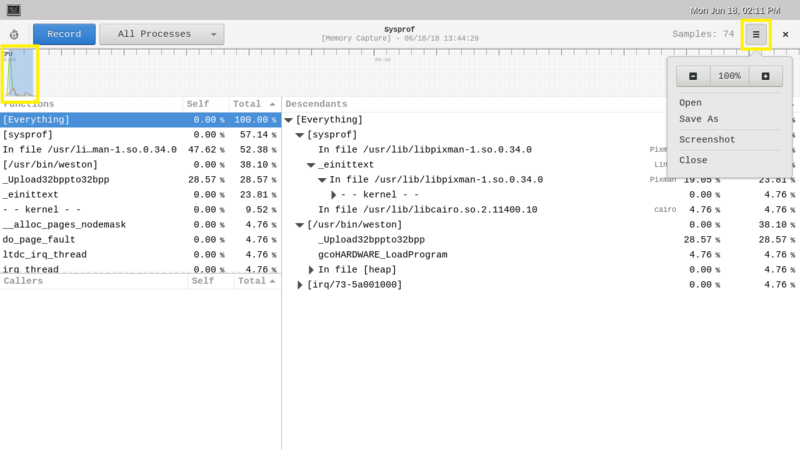
- The following report is then available on the board display:

5. To go further[edit source]
Several options are available to the user in order to filter the report, and then study the results:
- Possibility to browse on Functions list, Descendants list
- Possibility to select a certain period of the CPUs graph.
- Possibility to save traces, to make screen shots...

6. References[edit source]
- Useful external links
| Document link | Document Type | Description |
|---|---|---|
| Sysprof from Gnome | Standard | Wiki page |
| Profiling using Sysprof | User manual | Linux.com |