deleted>Frq08988 mNo edit summary |
Registered User No edit summary |
||
| Line 46: | Line 46: | ||
rect 563 390 676 455 [[Linux tracing, monitoring and debugging| Linux kernel]] | rect 563 390 676 455 [[Linux tracing, monitoring and debugging| Linux kernel]] | ||
rect 563 263 676 330 [[Linux tracing, monitoring and debugging| Linux applications]] | rect 563 263 676 330 [[Linux tracing, monitoring and debugging| Linux applications]] | ||
rect 217 389 330 454 [[OP-TEE - How to debug | OP-TEE]] | |||
rect 217 264 330 329 [[OP-TEE - How to debug | OP-TEE]] | |||
rect 341 390 439 454 [[TF-A - How to debug | TF-A]] | rect 341 390 439 454 [[TF-A - How to debug | TF-A]] | ||
rect 458 390 555 454 [[U-Boot - How to debug | U-Boot]] | rect 458 390 555 454 [[U-Boot - How to debug | U-Boot]] | ||
Revision as of 18:01, 12 February 2019
Template:ArticleApprovedVersion
The block diagram below shows the STM32MP1 Platform trace and debug environment components and their possible interfaces:
- The STM32MPU Embedded Software package (see STM32MPU Embedded Software architecture overview) that includes:
- The OpenSTLinux BSP and application frameworks components, running on the Arm® Cortex®-A core
- The STM32Cube MPU Package running on the Arm® Cortex®-M core
- The STM32MPU peripherals shared between Cortex®-A and Cortex®-M cores (such as GPIO, I2C and SPI)
- The user interfaces or tools, which allow to interact with different trace and debug Tools, such as:
- The remote shell using terminal console
- The debugger tools (such as GDB)
- The graphical IDE (such as GDBGUI or SystemWorkbench)
- The trace and debug interfaces or hardware paths that provide access to trace and debug components through:
- The network interface (e.g. Ethernet)
- The communication port (e.g UART)
- The hardware connector interfaces:
- JTag port
- Trace port to access ETM, STM, ITM and SWD
- I/O probes to access HDP
- The hardware probes such as ST-Link.
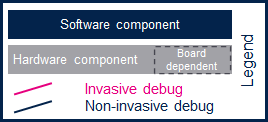
This block diagram also illustrates the Arm® debugging modes:
- Invasive debug: debug process that allows the control and monitoring of the processor. Most debug features are considered invasive because they enable you to halt the processor and modify its state.
- Non-invasive debug: debug process that allows the monitoring of the processor but not the control. The embedded trace macrocell (ETM) interface and the performance monitor registers are non-invasive debug features.
Click the figure below to directly jump to the component you want to trace, monitor or debug:
- By selecting a hardware component, you will be redirected to the corresponding hardware board article in order to check if the hardware connector is supported on your board.
- By selecting a target software component, you will be be redirected to an article that explains in details how to trace, monitor or debug this component.
- By selecting a host software component, you will be redirected to an article that explains how to use this remote tool.

Arm® is a registered trademark of Arm Limited (or its subsidiaries) in the US and/or elsewhere. ![]()