Registered User No edit summary |
Registered User mNo edit summary |
||
| (19 intermediate revisions by 4 users not shown) | |||
| Line 1: | Line 1: | ||
<noinclude> | <noinclude>{{ApplicableFor | ||
{{ | |MPUs list=STM32MP13x, STM32MP15x | ||
|MPUs checklist=STM32MP13x, STM32MP15x | |||
}}</noinclude> | |||
</noinclude> | |||
The block diagram below shows the {{highlight|'''STM32MP1 Platform trace and debug environment'''}} components and their possible interfaces: | The block diagram below shows the {{highlight|'''STM32MP1 Platform trace and debug environment'''}} components and their possible interfaces: | ||
| Line 11: | Line 8: | ||
* The '''STM32MPU Embedded Software''' package (see [[STM32MPU Embedded Software architecture overview]]) that includes: | * The '''STM32MPU Embedded Software''' package (see [[STM32MPU Embedded Software architecture overview]]) that includes: | ||
** The '''OpenSTLinux BSP''' and '''application frameworks''' components, running on the Arm<sup>®</sup> Cortex<sup>®</sup>-A core | ** The '''OpenSTLinux BSP''' and '''application frameworks''' components, running on the Arm<sup>®</sup> Cortex<sup>®</sup>-A core | ||
** The '''STM32Cube MPU Package''' running on the Arm<sup>®</sup> Cortex<sup>®</sup>-M core | ** The '''STM32Cube MPU Package''', on {{MicroprocessorDevice | device=15}} only, running on the Arm<sup>®</sup> Cortex<sup>®</sup>-M core | ||
* The '''STM32MPU peripherals''' shared between Cortex<sup>®</sup>-A and Cortex<sup>®</sup>-M cores (such as GPIO, I2C and SPI) | * The '''STM32MPU peripherals''' shared between Cortex<sup>®</sup>-A (on {{MicroprocessorDevice | device=1}}) and Cortex<sup>®</sup>-M (on {{MicroprocessorDevice | device=15}} only) cores (such as GPIO, I2C and SPI) | ||
* The '''user interfaces or tools''', which allow to interact with different trace and debug Tools, such as: | * The '''user interfaces or tools''', which allow to interact with different trace and debug Tools, such as: | ||
| Line 41: | Line 38: | ||
* By selecting a '''host software component''', you will be redirected to an article that explains how to use this remote tool. | * By selecting a '''host software component''', you will be redirected to an article that explains how to use this remote tool. | ||
{{ImageMap|Image: STM32MP1 Platform trace and debug environment overview.png{{!}} thumb{{!}} 800px {{!}} center {{!}} STM32MP1 Platform trace and debug environment overview. | {{ImageMap|Image: STM32MP1 Platform trace and debug environment overview.png{{!}} thumb{{!}} 800px {{!}} center {{!}} STM32MP1 Platform trace and debug environment overview. | ||
rect 128 0 | rect 128 0 360 63 [[How to get Terminal | Remote shell]] | ||
rect 402 0 | rect 402 0 635 63 [[GDB]] | ||
rect 563 390 676 455 [[Linux tracing, monitoring and debugging| Linux kernel]] | rect 563 390 676 455 [[Linux tracing, monitoring and debugging | Linux kernel]] | ||
rect 563 263 676 330 [[Linux tracing, monitoring and debugging| Linux applications]] | rect 563 263 676 330 [[Linux tracing, monitoring and debugging | Linux applications]] | ||
rect 217 389 330 454 [[ | rect 217 389 330 454 [[How to debug OP-TEE | OP-TEE]] | ||
rect 341 390 439 454 [[How to debug TF-A BL2 | TF-A]] | |||
rect 341 390 439 454 [[TF-A | |||
rect 458 390 555 454 [[U-Boot - How to debug | U-Boot]] | rect 458 390 555 454 [[U-Boot - How to debug | U-Boot]] | ||
rect | rect 808 228 926 476 [[STM32CubeMP1 Package | STM32CubeMP1 Package]] | ||
rect 78 320 197 380 [[ | rect 78 320 197 380 [[:Category:STM32 MPU boards | ComPort connector]] | ||
rect 504 152 625 212 [[ | rect 504 152 625 212 [[:Category:STM32 MPU boards | Network link]] | ||
rect 936 328 | rect 936 328 1054 392 [[:Category:STM32 MPU boards | JTag connector]] | ||
rect 1005 411 | rect 1005 411 1122 472 [[:Category:STM32 MPU boards | Trace connector]] | ||
rect 1071 497 | rect 1071 497 1188 559 [[:Category:STM32 MPU boards | IOProbe connector]] | ||
rect 672 73 | rect 672 73 906 137 [[:Category:Hardware probes | HW probes]] | ||
rect 450 600 565 625 [[STM32MP13_microprocessor]] | |||
rect 515 640 625 665 [[STM32MP15_microprocessor]] | |||
<!-- | <!-- | ||
rect 217 389 330 454 [[OpteeOS]] | rect 217 389 330 454 [[OpteeOS]] | ||
| Line 65: | Line 63: | ||
}} | }} | ||
[[File:STM32MP1 Platform trace and debug environment overview legend.png|center|link=]] | [[File:STM32MP1 Platform trace and debug environment overview legend.png|center|link=]] | ||
<noinclude> | |||
{{PublicationRequestId | 9565 | 2018-11-12 | AnneJ}} | |||
[[Category:Trace and debug tools|0]] | |||
</noinclude> | |||
Latest revision as of 13:58, 27 September 2022
The block diagram below shows the STM32MP1 Platform trace and debug environment components and their possible interfaces:
- The STM32MPU Embedded Software package (see STM32MPU Embedded Software architecture overview) that includes:
- The OpenSTLinux BSP and application frameworks components, running on the Arm® Cortex®-A core
- The STM32Cube MPU Package, on STM32MP15x lines
 only, running on the Arm® Cortex®-M core
- The STM32MPU peripherals shared between Cortex®-A (on STM32MP1 Series) and Cortex®-M (on STM32MP15x lines only) cores (such as GPIO, I2C and SPI)
- The user interfaces or tools, which allow to interact with different trace and debug Tools, such as:
- The remote shell using terminal console
- The debugger tools (such as GDB)
- The graphical IDE (such as GDBGUI or SystemWorkbench)
- The trace and debug interfaces or hardware paths that provide access to trace and debug components through:
- The network interface (e.g. Ethernet)
- The communication port (e.g UART)
- The hardware connector interfaces:
- JTag port
- Trace port to access ETM, STM, ITM and SWD
- I/O probes to access HDP
- The hardware probes such as ST-Link.
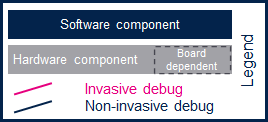
This block diagram also illustrates the Arm® debugging modes:
- Invasive debug: debug process that allows the control and monitoring of the processor. Most debug features are considered invasive because they enable you to halt the processor and modify its state.
- Non-invasive debug: debug process that allows the monitoring of the processor but not the control. The embedded trace macrocell (ETM) interface and the performance monitor registers are non-invasive debug features.
Click the figure below to directly jump to the component you want to trace, monitor or debug:
- By selecting a hardware component, you will be redirected to the corresponding hardware board article in order to check if the hardware connector is supported on your board.
- By selecting a target software component, you will be be redirected to an article that explains in details how to trace, monitor or debug this component.
- By selecting a host software component, you will be redirected to an article that explains how to use this remote tool.

Arm® is a registered trademark of Arm Limited (or its subsidiaries) in the US and/or elsewhere. ![]()