This article provides guidelines to setup environment for developing and debugging a user space application using STM32CubeIDE.
1. Prerequisites[edit source]
Minimum hardware
- STM32MP15x-based board
- Linux console
- Ethernet (or Ethernet over USB) for connection to Linux® Cortex®-A
Minimum software
- STM32CubeIDE v1.4.2 installed and
- STM32MP15 project created
- Yocto SDK installed thanks to "Setup OpenSTLinux" Cortex-A contextual menu
Screenshots, illustrating this article, have been taken using STM32CubeIDE v1.4.2. In same way, examples of paths correspond to STM32CubeIDE v1.4.2.
2. Create a "user space" project[edit source]
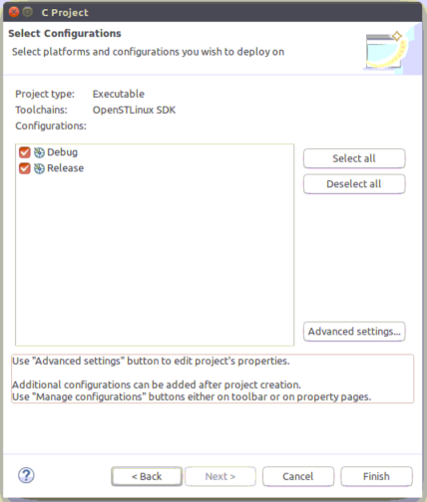
- Open new C Project wizard: File -> New -> Project... C Project.
- In first window, choose OpenSTLinux SDK
- then Next and Advanced settings...
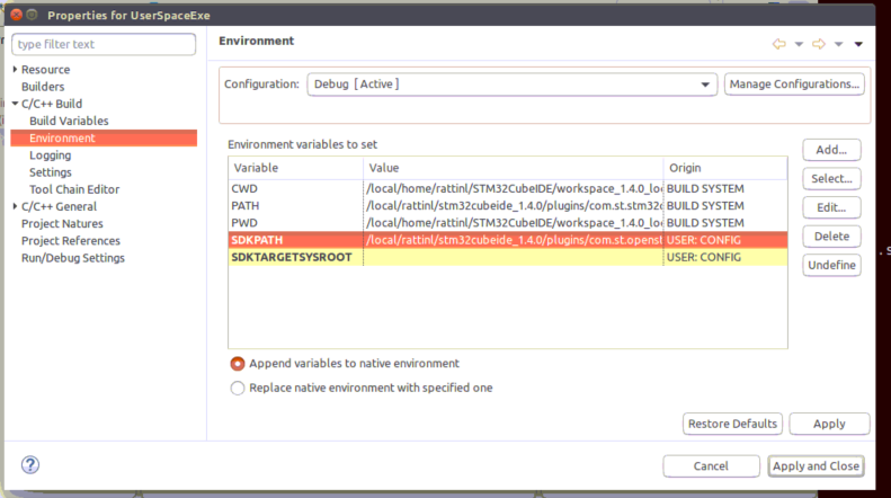
- Setup SDKPATH variable into Project Properties > C/C++ Build > Environment
- select first the configuration you want to use Debug or Release,
- then Edit variable > Variables
- If SDK installation is embedded inside STM32CubeIDE then toolchain is located under (e.g. with STM32CubeIDE v1.4.2) :<InstallDir>/plugins/com.st.openstlinux.sdk.openstlinux_5.4_dunfell_mp1_20_06_24_5.4.0.202007020712/tools/
- In case SDK is installed on your disk, give its installation path :
- To populate this project with "main.c" file, select project, right click: New -> File -> main.c and fill it with some C code.
3. Build[edit source]
- Select your project, right-click and then Build Project.
4. Preparing Debug Configuration[edit source]
Your target must be Linux booted and network connected. In order to check it, please, start Target Status widget on the bottom right.
Target Status widget creates MPU SSH in Connections view (Window > Show View > Other… Connections > Connections) to be used in Debug Configuration
5. Debug Configuration[edit source]
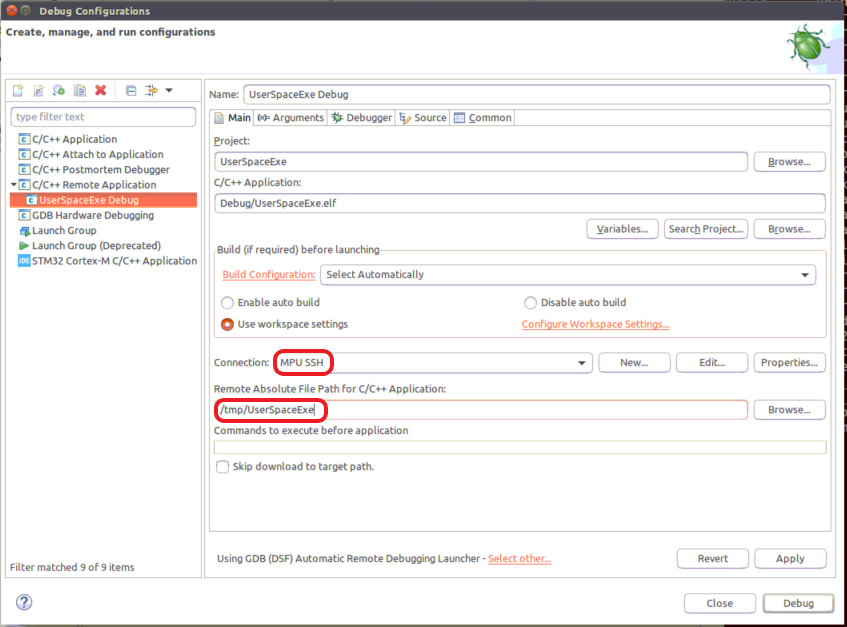
- Select your project, right-click Debug as... > Debug Configurations.
- Then create a C/C++ Remote Application debug configuration, double clicking on it.
5.1. Main tab[edit source]
- Fill a destination directory, for example: /tmp/UserSpaceExe
- Select a connection: MPU SSH
5.2. Debugger tab[edit source]
Now set-up GDB Client with SDK one
- For SDK embedded and installed inside STM32CubeIDE (e.g. with STM32CubeIDE v1.4.2) :<Stm32CubeIDEInstallDir>/plugins/com.st.openstlinux.sdk.openstlinux_5.4_dunfell_mp1_20_06_24_5.4.0.202007020712/tools/sysroots/x86_64-ostl_sdk-linux/usr/bin/arm-ostl-linux-gnueabi/arm-ostl-linux-gnueabi-gdb
- For SDK installed on disk : <SdkInstallDir>/sysroots/x86_64-ostl_sdk-linux/usr/bin/arm-ostl-linux-gnueabi/arm-ostl-linux-gnueabi-gdb
6. Debug[edit source]
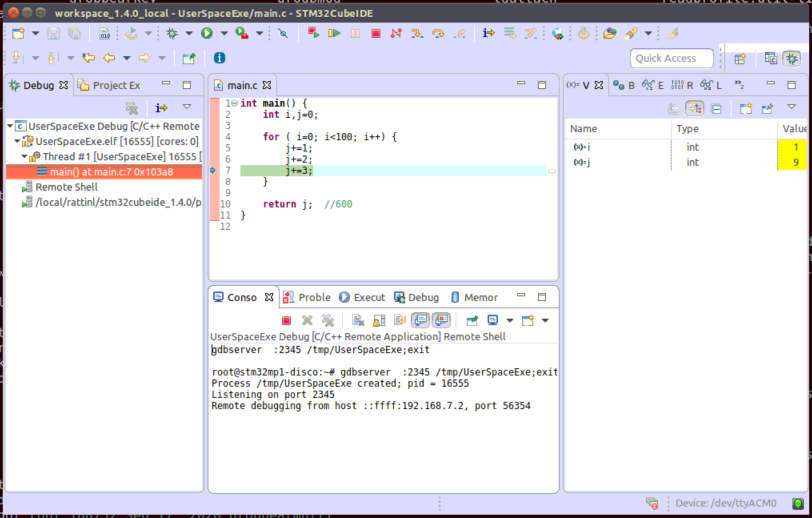
Click Debug :
- Executable is downloaded to the target,
- GDBServer is launched on the target,
- GDBClient is launched on the workstation and can exchange via network with GDBServer,


