1. Article purpose[edit source]
This article provides basic information needed to start using the Linux® kernel tool: perf[1].
2. Introduction[edit source]
The following table provides a brief description of the tool, as well as its availability depending on the software packages:
![]() : this tool is either present (ready to use or to be activated), or can be integrated and activated on the software package.
: this tool is either present (ready to use or to be activated), or can be integrated and activated on the software package.
![]() : this tool is not present and cannot be integrated, or it is present but cannot be activated on the software package.
: this tool is not present and cannot be integrated, or it is present but cannot be activated on the software package.
| Tool | STM32MPU Embedded Software distribution | STM32MPU Embedded Softwaredistribution for Android™ | ||||||
|---|---|---|---|---|---|---|---|---|
| Name | Category | Purpose | Starter Package | Developer Package | Distribution Package | Starter Package | Developer Package | Distribution Package |
| perf | Monitoring tools | perf[1] is a Linux user space tool, which allows getting system performance figures | ||||||
| Note: simpleperf[2] is present as equivalent but with less options | ||||||||
3. Installing the trace and debug tool on your target board[edit source]
3.1. Using the STM32MPU Embedded Software distribution[edit source]
perf is installed by default and ready to be used in all the STM32MPU Embedded Software Packages.
 which perf
/usr/bin/perf
It is integrated in the weston image distribution through openembedded-core package: openembedded-core/meta/recipes-core/packagegroups/packagegroup-core-tools-profile.bb.
RRECOMMENDS_${PN} = "\
   ${PERF} \
   trace-cmd \
   blktrace \
   ${PROFILE_TOOLS_X} \
   ${PROFILE_TOOLS_SYSTEMD} \
   "
...
PERF = "perf"
3.2. Using the STM32MPU Embedded Software distribution for Android™[edit source]
simpleperf[2] is equivalent to perf, and is installed by default (/system/xbin/simpleperf) and is ready to be used with all STM32MPU software packages for Android™.
 which simpleperf
/system/xbin/simpleperf
It supports less options:
 simpleperf --help
Usage: simpleperf [common options] subcommand [args_for_subcommand]
common options:
    -h/--help     Print this help information.
    --log <severity> Set the minimum severity of logging. Possible severities
                       include verbose, debug, warning, info, error, fatal.
                       Default is info.
    --version     Print version of simpleperf.
subcommands:
    debug-unwind        Debug/test offline unwinding.
    dump                dump perf record file
    help                print help information for simpleperf
    kmem                collect kernel memory allocation information
    list                list available event types
    record              record sampling info in perf.data
    report              report sampling information in perf.data
    report-sample       report raw sample information in perf.data
    stat                gather performance counter information
4. Getting started[edit source]
4.1. Perf commands[edit source]
usage: perf [--version] [--help] [OPTIONS] COMMAND [ARGS]

The most commonly used perf commands are:
  annotate        Reads perf.data (created by perf record) and displays annotated code
  archive         Creates archive with object files with build-ids found in perf.data file
  bench           General framework for benchmark suites
  buildid-cache   Manages build-id cache.
  buildid-list    Lists the buildids in a perf.data file
  c2c             Shared Data C2C/HITM Analyzer.
  config          Gets and sets variables in a configuration file.
  data            Data file related processing
  diff            Reads perf.data files and displays the differential profile
  evlist          Lists the event names in a perf.data file
  ftrace          simple wrapper for kernel's ftrace functionality
  inject          Filters to augment the events stream with additional information
  kallsyms        Searches running kernel for symbols
  kmem            Tool to trace/measure kernel memory properties
  kvm             Tool to trace/measure kvm guest os
  list            Lists all symbolic event types
  lock            Analyzes lock events
  mem             Profiles memory accesses
  record          Runs a command and records its profile into perf.data
  report          Reads perf.data (created by perf record) and displays the profile
  sched           Tool to trace/measure scheduler properties (latencies)
  script          Reads perf.data (created by perf record) and displays trace output
  stat            Runs a command and gathers performance counter statistics
  test            Runs sanity tests.
  timechart       Tool to visualize total system behavior during a workload
  top             System profiling tool.
  probe           Defines new dynamic tracepoints

See 'perf COMMAND -h' for more information on a specific command.
4.2. Most useful commands with simple to use interface[edit source]
- perf top (Linux kernel documentation[3]): provides the CPU load by counting the number of cycles events; the default order is descending the number of samples per symbol:
 perf top
 40.62%  [kernel]                           [k] v7_dma_inv_range
 18.65%  [kernel]                           [k] _raw_spin_unlock_irqrestore
 17.01%  [kernel]                           [k] arch_cpu_idle
  8.27%  [kernel]                           [k] v7_dma_clean_range
  5.00%  [kernel]                           [k] rcu_idle_exit
  1.70%  [kernel]                           [k] cpu_startup_entry
  0.52%  [kernel]                           [k] trace_graph_return
  0.48%  [kernel]                           [k] finish_task_switch
  0.48%  libc-2.18.so                       [.] memcpy
  0.47%  [kernel]                           [k] trace_graph_entry
- Means that CPU is spending 40% of time in function v7_dma_inv_range, and 18.65% in _raw_spin_unlock_irqrestore.
- More information and examples are available in perf.wiki.kernel.org[4]
- This is also possible to display the result in a specified sorting:
Usage: perf top [<options>]
   -s, --sort <key[,key2...]>
              sort by key(s): pid, comm, dso, symbol, parent, cpu, srcline, ... Please refer to the main page for the complete list.
- perf stat (Linux kernel documentation[5]): obtains event counts
 perf stat hello_world_example
User space example: hello world from STMicroelectronics
10 9 8 7 6 5 4 3 2 1 0
User space example: goodbye from STMicroelectronics

Performance counter stats for 'hello_world_example':

         4.328249      task-clock (msec)         #    0.000 CPUs utilized
               11      context-switches          #    0.003 M/sec
                0      cpu-migrations            #    0.000 K/sec
               38      page-faults               #    0.009 M/sec
          2710036      cycles                    #    0.626 GHz
           640856      instructions              #    0.24  insn per cycle
            75644      branches                  #   17.477 M/sec
            21764      branch-misses             #   28.77% of all branches

     11.109859338 seconds time elapsed
- More information and examples are available in perf.wiki.kernel.org[6].
- perf list (Linux kernel documentation[7]): supported symbolic event types
 perf list
 branch-instructions OR branches                    [Hardware event]
 branch-misses                                      [Hardware event]
 bus-cycles                                         [Hardware event]
 cache-misses                                       [Hardware event]
 cache-references                                   [Hardware event]
 cpu-cycles OR cycles                               [Hardware event]
 instructions                                       [Hardware event]
 alignment-faults                                   [Software event]
 bpf-output                                         [Software event]
 context-switches OR cs                             [Software event]
 cpu-clock                                          [Software event]
 cpu-migrations OR migrations                       [Software event]
 dummy                                              [Software event]
 emulation-faults                                   [Software event]
 major-faults                                       [Software event]
 minor-faults                                       [Software event]
 page-faults OR faults                              [Software event]
 task-clock                                         [Software event]
 L1-dcache-load-misses                              [Hardware cache event]
 L1-dcache-loads                                    [Hardware cache event]
 L1-dcache-store-misses                             [Hardware cache event]
 L1-dcache-stores                                   [Hardware cache event]
 L1-icache-load-misses                              [Hardware cache event]
 L1-icache-loads                                    [Hardware cache event]
 LLC-load-misses                                    [Hardware cache event]
 LLC-loads                                          [Hardware cache event]
 LLC-store-misses                                   [Hardware cache event]
 LLC-stores                                         [Hardware cache event]
 branch-load-misses                                 [Hardware cache event]
 branch-loads                                       [Hardware cache event]
 dTLB-load-misses                                   [Hardware cache event]
 dTLB-store-misses                                  [Hardware cache event]
 iTLB-load-misses                                   [Hardware cache event]
 armv7_cortex_a7/br_immed_retired/                  [Kernel PMU event]
 armv7_cortex_a7/br_mis_pred/                       [Kernel PMU event]
 armv7_cortex_a7/br_pred/                           [Kernel PMU event]
 armv7_cortex_a7/br_return_retired/                 [Kernel PMU event]
 armv7_cortex_a7/bus_access/                        [Kernel PMU event]
 armv7_cortex_a7/bus_cycles/                        [Kernel PMU event]
 armv7_cortex_a7/cid_write_retired/                 [Kernel PMU event]
 armv7_cortex_a7/cpu_cycles/                        [Kernel PMU event]
 armv7_cortex_a7/exc_return/                        [Kernel PMU event]
 armv7_cortex_a7/exc_taken/                         [Kernel PMU event]
 armv7_cortex_a7/inst_retired/                      [Kernel PMU event]
 armv7_cortex_a7/inst_spec/                         [Kernel PMU event]
 armv7_cortex_a7/l1d_cache/                         [Kernel PMU event]
 armv7_cortex_a7/l1d_cache_refill/                  [Kernel PMU event]
 armv7_cortex_a7/l1d_cache_wb/                      [Kernel PMU event]
 armv7_cortex_a7/l1d_tlb_refill/                    [Kernel PMU event]
 armv7_cortex_a7/l1i_cache/                         [Kernel PMU event]
 armv7_cortex_a7/l1i_cache_refill/                  [Kernel PMU event]
 armv7_cortex_a7/l1i_tlb_refill/                    [Kernel PMU event]
 armv7_cortex_a7/l2d_cache/                         [Kernel PMU event]
 armv7_cortex_a7/l2d_cache_refill/                  [Kernel PMU event]
 armv7_cortex_a7/l2d_cache_wb/                      [Kernel PMU event]
 armv7_cortex_a7/ld_retired/                        [Kernel PMU event]
 armv7_cortex_a7/mem_access/                        [Kernel PMU event]
 armv7_cortex_a7/memory_error/                      [Kernel PMU event]
 armv7_cortex_a7/pc_write_retired/                  [Kernel PMU event]
 armv7_cortex_a7/st_retired/                        [Kernel PMU event]
 armv7_cortex_a7/sw_incr/                           [Kernel PMU event]
 armv7_cortex_a7/ttbr_write_retired/                [Kernel PMU event]
 armv7_cortex_a7/unaligned_ldst_retired/            [Kernel PMU event]
 rNNN                                               [Raw hardware event descriptor]
 cpu/t1=v1[,t2=v2,t3 ...]/modifier                  [Raw hardware event descriptor]
 mem:<addr>[/len][:access]                          [Hardware breakpoint]
 alarmtimer:alarmtimer_cancel                       [Tracepoint event]
 alarmtimer:alarmtimer_fired                        [Tracepoint event]
 alarmtimer:alarmtimer_start                        [Tracepoint event]
 alarmtimer:alarmtimer_suspend                      [Tracepoint event]
 asoc:snd_soc_bias_level_done                       [Tracepoint event]
 asoc:snd_soc_bias_level_start                      [Tracepoint event]
 asoc:snd_soc_dapm_connected                        [Tracepoint event]
 asoc:snd_soc_dapm_done                             [Tracepoint event]
 asoc:snd_soc_dapm_path                             [Tracepoint event]
 asoc:snd_soc_dapm_start                            [Tracepoint event]
 asoc:snd_soc_dapm_walk_done                        [Tracepoint event]
 asoc:snd_soc_dapm_widget_event_done                [Tracepoint event]
 asoc:snd_soc_dapm_widget_event_start               [Tracepoint event]
...
 xhci-hcd:xhci_inc_enq                              [Tracepoint event]
 xhci-hcd:xhci_queue_trb                            [Tracepoint event]
 xhci-hcd:xhci_ring_alloc                           [Tracepoint event]
 xhci-hcd:xhci_ring_expansion                       [Tracepoint event]
 xhci-hcd:xhci_ring_free                            [Tracepoint event]
 xhci-hcd:xhci_setup_addressable_virt_device        [Tracepoint event]
 xhci-hcd:xhci_setup_device                         [Tracepoint event]
 xhci-hcd:xhci_setup_device_slot                    [Tracepoint event]
 xhci-hcd:xhci_stop_device                          [Tracepoint event]
 xhci-hcd:xhci_urb_dequeue                          [Tracepoint event]
 xhci-hcd:xhci_urb_enqueue                          [Tracepoint event]
 xhci-hcd:xhci_urb_giveback                         [Tracepoint event]
- perf record (Linux kernel documentation[8]): records events for later reporting
 perf record hello_world_example

User space example: hello world from STMicroelectronics
10 9 8 7 6 5 4 3 2 1 0
User space example: goodbye from STMicroelectronics
[ perf record: Woken up 1 time to write data ]
[ perf record: Captured and wrote 0.004 MB perf.data (28 samples) ]
- This is possible to filter events (given by perf list command). More information, options and examples are available in perf.wiki.kernel.org[9].
- By default, the events are recorded in the perf.data file. If you want to specify another output file name you have to add -o, --output <file> option.
- perf report (Linux kernel documentation[10]): breaks down the events by process, function, etc.
Example after previous command "perf record hello_world_example"
 perf report
Samples: 28  of event 'cycles:ppp', Event count (approx.):2737925
Overhead  Command          Shared Object Symbol
  12.66%  hello_world_exa  ld-2.26.so         [.] _dl_relocate_object
  11.71%  hello_world_exa  [kernel.kallsyms]  [k] filemap_map_pages
  10.65%  hello_world_exa  [kernel.kallsyms]  [k] n_tty_write
   6.43%  hello_world_exa  [kernel.kallsyms]  [k] percpu_counter_add_batch
   6.43%  hello_world_exa  ld-2.26.so         [.] sbrk
   6.24%  hello_world_exa  [kernel.kallsyms]  [k] cpu_v7_set_pte_ext
   5.56%  hello_world_exa  [kernel.kallsyms]  [k] alloc_set_pte
   5.56%  hello_world_exa  libc-2.26.so       [.] __sbrk
   5.37%  hello_world_exa  [kernel.kallsyms]  [k] __vma_link_file
   5.32%  hello_world_exa  [kernel.kallsyms]  [k] __fput
   5.32%  hello_world_exa  [kernel.kallsyms]  [k] ldsem_up_read
   5.32%  hello_world_exa  [kernel.kallsyms]  [k] unmap_page_range
   5.32%  hello_world_exa  libc-2.26.so       [.] printf
   5.24%  hello_world_exa  [kernel.kallsyms]  [k] _raw_spin_unlock_irqrestore
   2.23%  hello_world_exa  [kernel.kallsyms]  [k] perf_event_mmap
   0.48%  hello_world_exa  [kernel.kallsyms]  [k] perf_output_begin
   0.13%  perf             [kernel.kallsyms]  [k] perf_event_exec
- By default, report file perf.data is read as input file. If you want to specify another input file name you have to add -i, --input <file> option.
- More information and examples are available in perf.wiki.kernel.org[11].
- perf bench (Linux kernel documentation[12]): runs different kernel microbenchmarks:
# List of all available benchmark collections:

        sched: Scheduler and IPC benchmarks
          mem: Memory access benchmarks
        futex: Futex stressing benchmarks
          all: All benchmarks
Example of getting memcpy benchmark for 100MB:
 perf bench mem memcpy --size 100MB
# Running 'mem/memcpy' benchmark:
# function 'default' (Default memcpy() provided by glibc)
# Copying 100MB bytes ...

       1.426138 GB/sec
- More information and examples are available in perf.wiki.kernel.org[13].
5. To go further[edit source]
5.1. Visualizing trace using Flame Graphs[edit source]
As part of Flame Graphs[14], this is possible to visualize trace coming from perf.
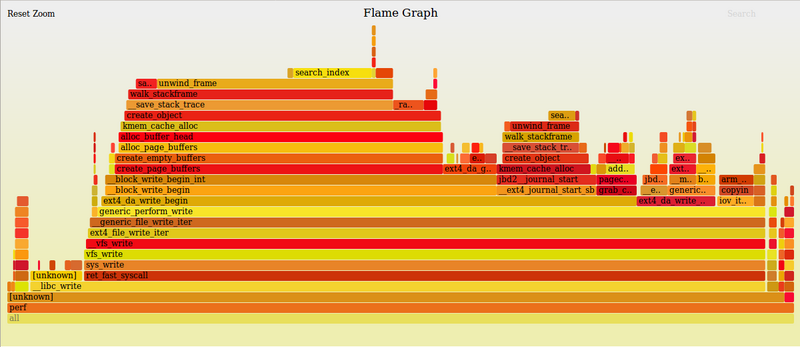
The Flame graphs are generated using Flame graphs tool suite[15].
- Install the Flame Graph tool suite on host PC side
 cd <your_local_path>
 git clone https://github.com/brendangregg/FlameGraph.git
 cd FlameGraph
- Generate a Flame graph from perf tool
- When generating perf record, -g option must be added.
As example for a top command:
- Perform perf record command on board side
 perf record -a -g top
 perf script > perf_top.out

- Copy perf_top.out on your host PC (i.e. in the FlameGraph directory)

- Perform the flame graph generation on host PC side using stackcollapse-perf.pl script
 ./stackcollapse-perf.pl perf_top.out > out.top_folded

- Use flamegraph.pl to render a SVG (Scalable Vector Graphics) file.
 ./flamegraph.pl out.top_folded > top.svg

- Visualize SVG using web browser for example
 firefox top.svg
6. References[edit source]
- ↑ Jump up to: 1.0 1.1 https://perf.wiki.kernel.org/index.php/Main_Page
- ↑ Jump up to: 2.0 2.1 https://source.android.com/devices/tech/debug/eval_perf
- ↑ tools/perf/Documentation/perf-top.txt
- ↑ https://perf.wiki.kernel.org/index.php/Tutorial#Live_analysis_with_perf_top
- ↑ tools/perf/Documentation/perf-stat.txt
- ↑ https://perf.wiki.kernel.org/index.php/Tutorial#Counting_with_perf_stat
- ↑ tools/perf/Documentation/perf-list.txt
- ↑ tools/perf/Documentation/perf-record.txt
- ↑ https://perf.wiki.kernel.org/index.php/Tutorial#Sampling_with_perf_record
- ↑ tools/perf/Documentation/perf-report.txt
- ↑ https://perf.wiki.kernel.org/index.php/Tutorial#Sample_analysis_with_perf_report
- ↑ tools/perf/Documentation/perf-bench.txt
- ↑ https://perf.wiki.kernel.org/index.php/Tutorial#Benchmarking_with_perf_bench
- ↑ http://www.brendangregg.com/flamegraphs.html
- ↑ https://github.com/brendangregg/FlameGraph
- Useful external links
| Document link | Document Type | Description |
|---|---|---|
| perf tutorial | User Guide | perf.wiki.kernel.org |
| perf (wikipedia.org) | Standard | wikipedia.org |
| Brendan Gregg's perf page | Perf example | From Brendan Gregg |
| Eclipse perf plugin page | Eclipse perf plugin | Eclipse.org |
Arm® is a registered trademark of Arm Limited (or its subsidiaries) in the US and/or elsewhere. ![]()