- Last edited 4 months ago ago
STM32 MC Motor Pilot - Start-up guide

Based on STM32 MC Motor Pilot 6.1 V1.1.3 (included in STM32 MC-SDK 6.1).
Contents
- 1 Overview of the STM32 MC Motor Pilot tool
- 2 STM32 MC Motor Pilot quick guide
- 3 MC application parameters
- 4 MC application advanced settings
- 4.1 Speed PID, Toque PID, Flux PID and Flux reference
- 4.2 State Observer, PLL parameters, CORDIC parameters
- 4.3 Rev-up configuration
- 4.4 Handling errors
- 4.5 Viewing and plotting registers with low-speed plotting
- 4.6 Viewing and plotting registers with high-speed plotting
- 4.7 UI is changeable at run-time
- 5 Motor Profiler
1 Overview of the STM32 MC Motor Pilot tool
The STM32 MC Motor Pilot is a monitoring tool for STM32 motor-control applications that:
- connects to MC applications built with the UI module through the serial port
- uses the snew Monitor and Control Protocol (MCPV2)
- allows for controlling, monitoring, and tuning MC applications
- replaces the monitor part of STM32 MC workbench 4.X

The added value features of the STM32 MC Motor Pilot are the following :
- Enhanced plotting feature: the user can now plot most registers.
- Real time monitoring : registers for each PWM sample can be retrieve, plot and record
- GUI customization : the user can easily customize the GUI at run time to fit specific needs or to experiment with new firmware features.
- Solid foundation to support future firmware features (ACIM, 6-Step, sensor-less zero speed, enhanced debug features).
- Runs on Windows, Mac, and Linux platforms.
2 STM32 MC Motor Pilot quick guide
2.1 Installation and run
STM32 MC Motor Pilot is now automatically installed with STM32 MC SDK.
A shortcut is created on the Windows menu to run it.
2.2 Quick start-up
When you start Motor Pilot for the first time , you can choose 3 different actions:
- Detecting the connected board.
Motor Pilot tries to communicate on all STLINK Virtual Port COM at 1843200 Mbaud to detect your board. If the detection succeeds, the Motor Pilot loads the corresponding UI.
- Loading the UI that is dedicated to the FOC SDK profiler.
- Loading the custom UI.
2.2.1 Quick step 1
If the automatic detection process failed, then press Load UI and select a qml file with the dedicated UI for your application.
At this moment, Motor Pilot is not connected:
And it lists the available serial ports:
- Connect a Motor Control board to the PC.
- Select the port and the baudrate according to your apllication.
- Click Connect.

2.2.2 Quick step 2
- Connect Motor Pilot to
- retrieve the embedded firmware features,
- retrieve important parameters of motor control from the board and adjust the GUI with such information,
- start monitoring the parameters needed by the GUI:
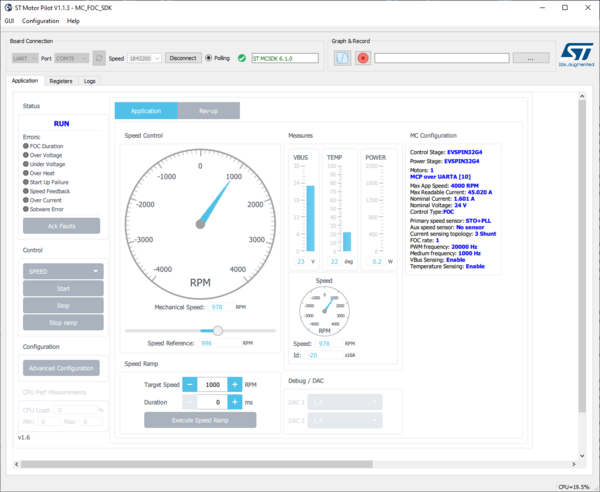
- Spin the motor by clicking on the Start button:

- Motor starts and the pilot updates the GUI:

2.2.3 Quick step 3
To control the motor, you can perform these actions:
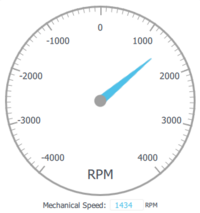
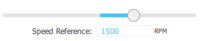
- Slide the knob to set the speed:
- Set Target Speed and Duration and click Execute Speed Ramp to apply this ramp :
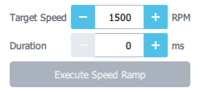
- Click Stop Ramp to immediately stop the ramp:

- Click Stop to stop spinning the motor:


3 MC application parameters
The STM32 MC Motor Pilot obtains the MC application parameters from the board and adapts widgets to them.

3.1 DAC
If the DAC feature is enabled in the firmware, the DAC widget will be enabled with its corresponding capabilties.

3.2 CPU Performance Measurement
If the MCU Load feature is enabled in the firmware, the CPU Performance Measurement widget will be enabled with its corresponding capabilties.

4 MC application advanced settings
4.1 Speed PID, Toque PID, Flux PID and Flux reference
- Click Advanced Configuration to display another panel with additional settings:
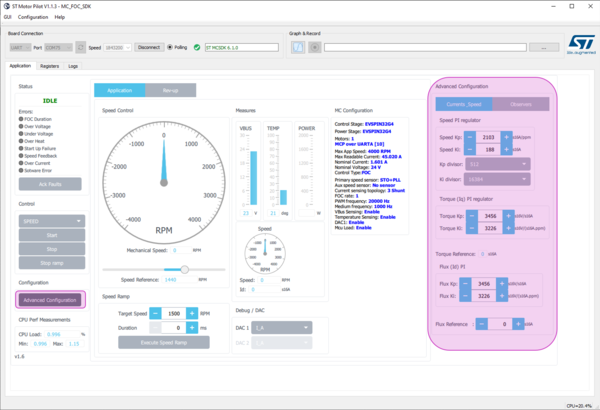
- Customize the following settings from this panel:
- Speed PID
- Toque PID
- Flux PID
- Set Flux reference

Depending of the features available on your firmware, some of the settings can be disabled.
4.2 State Observer, PLL parameters, CORDIC parameters
- Click Advanced Configuration to display another panel with additional settings.
- You can Customize the following settings from this panel:
- State Observer + PLL parameters
- State Observer + CORDIC parameters
Depending of the features available on your firmware, some of the settings can be disabled.

4.3 Rev-up configuration
Click on Rev-up tab to display rev-up parameters:

Then click on Read all to read rev-up parameters from the board.

- This panel allows to set up to 5 rev-up steps by direct edit in the corresponding table for which a step rev-up duration, a final torque value and a final speed value are defined. Use the same values to have less steps.
You can switch display from s16A to Amp but you need to fill current sensing parameters according to your board.

4.4 Handling errors
4.4.1 Control Board disconnection
Board freeze due to firmware critical error or breakpoint trigger:
- Resume execution or reset the board to resume the connection.

4.4.2 Firmware errors
Current and past errors are indicated as in the example below.
- In the FAULT_NOW state, the Ack Faults button has no effect.

- Once the fault conditions are cleared, enter the FAULT_OVER state.

- Click Ack Faults to go back to IDLE.

4.5 Viewing and plotting registers with low-speed plotting
With this method of plot, plotting any register is possible at low rate (polling every 200 ms by default).
- Click the Registers tab to display the list containing all of the registers.
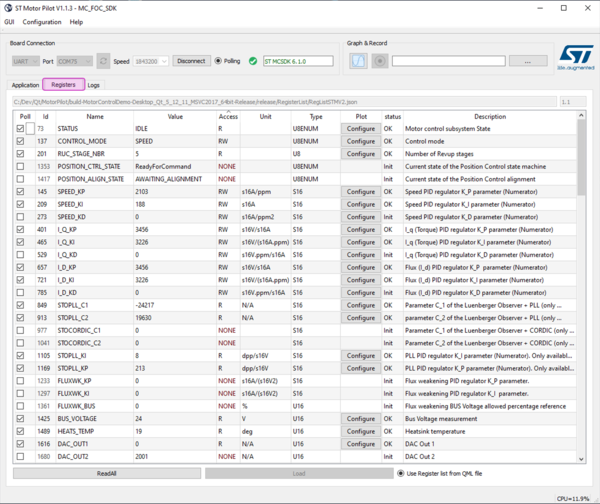
- Click the Configure button to:


- add register plot into a new plot window,

- or add it into an existing plot window.


- The user can stop plotting the register:

4.6 Viewing and plotting registers with high-speed plotting
Plotting at PWM frequency rate is only possible for a subset of registers with this method of plot.
- Once the motor is connected and started, click the Plot button:
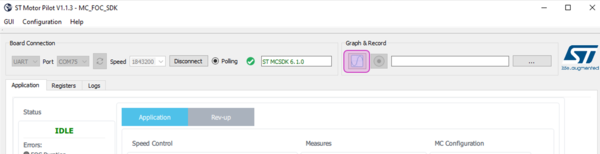
- A High Frequency Plot window opens:

- Click again to open more plot windows.
- Resize these windows to optimize the display of plots on your desktop.
- Right-click to select the register to plot:
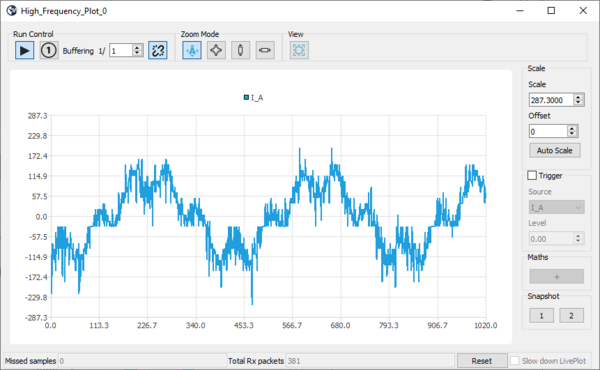
- Click again to plot more registers:
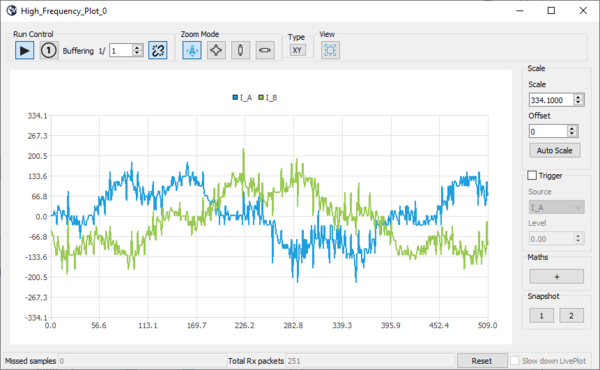
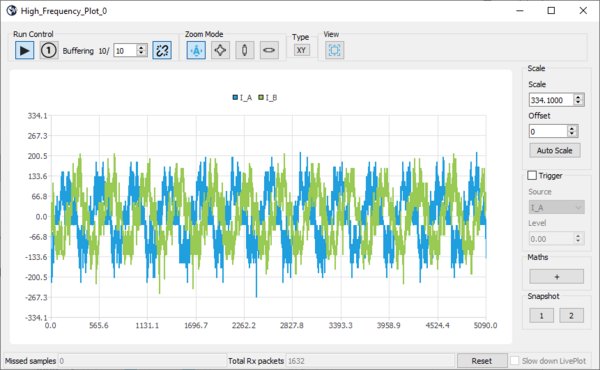
- The data display width is defined by adjusting the buffer size. Change buffering to display more data.
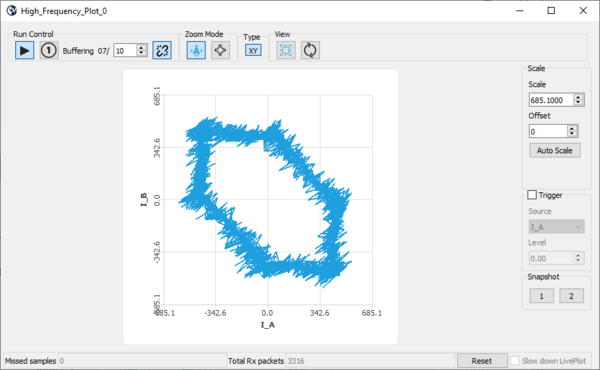
- When displaying 2 registers, you can switch to the X / Y plot:
- Dynamic plot display can be paused and resumed as desired.
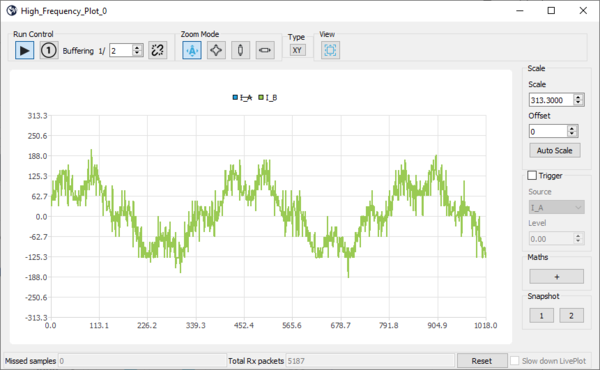
- Each register plot can be hidden or displayed by double-clicking on the register name in the plot legend. Then, when the register plot is hidden, the corresponding register name is strikethrough.


4.7 UI is changeable at run-time
- Click the File menu item, then Load.
- Search for a .qml file and open it. For instance, GUI\PositionControlApp.qml found in the release.
- This loads a new GUI with other features. In the case of PositionControlApp.qml, a position control enabled monitoring application.

- Users can change the UI by copying any existing ".qml" file and editing it.
5 Motor Profiler
The Motor Profiler software is now integrated to the Motor Pilot as a QML file. It allows the user to:
- automatically detect the board,
- do a profiling with the Hall sensors,
- detect the number of Pole pairs with guided detection.
The homepage has a similar look to the previous tool. It is possible from the homepage to make a manual selection of boards, and to launch the automatic detection of boards.
Once the board is selected, it is also possible to launch Motor profiling, to launch the Hall profiling and to save the data of the profiled motor.
5.1 Start Motor Profiling
5.1.1 Select the board manually
To manually select a board, click the Select boards button as in the picture below.
On the board selection page, search for boards by filtering by control board name (text field 1) or by power board name (text field 2).
5.1.2 Connect board
After selecting the boards, the Connect button becomes active, and you can start the connection to the board.
If a firmware profiler is present on the board and the board checks are error free, go to the Set profiling parameter chapter. Otherwise, you can install a compatible profiler firmware using the UI. Accept to use the profiler.
The firmware present on the board is erased. The new profiler firmware is flashed on the board, and we restart the connection with the board.
If the connection is successful, go to Set profiler parameter chapter.
5.1.3 Detect boards
A new feature of this profiler allows the possibility to automatically detect control board and power board. To do so, the Motor profiler reads the information from the firmware and displays the detected boards. To start the automatic detection, click the Detect board button.
The profiler tries to detect the boards. Several tests are done:
- Check if an ST-Link is connected to the computer.
- Check if the MCU uid detected by the ST-Link is supported by the Profiler.
- Check if the board name written on the ST-link is supported by the Profiler.
- Try to connect with uart to the board.
- If the uart connection was successful, check if Firmware is Profiler firmware.
- Check if the control board detected on the firmware is the same as the one detected with ST-Link. Also, check if it is known on the profiler database.
- Check if the power board detected on the firmware it is known on the profiler database.
When these checks are successful, the interface displays the board. Otherwise, the user is offered a choice close to what was detected.
5.1.4 Profiling parameter
After connecting the card, you can start profiling. For this purpose, it is necessary to fill in the field of the Pole pair (in red). For a more efficient profiling, you can fill in the fields in green if you have the necessary data. If you don't know the number of even Poles, go to the chapter About Pole pair detection.
5.1.5 Start profiling
Click Start Profile to profile the motor. First, the electrical parameters are identified, then the mechanical ones. When profiling is completed, all the motor measurements are shown on the bottom of screen.
If the profiling process takes too long, the information entered is incorrect: the max speed value is too high or too low.
5.1.6 Start hall profiling
The Hall profiling feature is a new feature that has been added to the profiler. It allows to use the hall sensors to have a better control of the motor. To run the hall profiler, click the Start Hall profiling button.
When you click the Start Hall profiling button, a new interface appears on the lower part of the profiler. A warning message appears to signal the user to check the connection of the Hall sensors.
This window warns the user that the connectors of the hall sensors are incorrectly connected. It indicates which of these connectors are incorrectly connected, to easily change them if access to the connectors is available. Enter your changes and click Continue. Otherwise, the user can cancel the profiling.
You must also confirm that the motor is running in the correct direction to get consistent results.
Profiling is done on both directions of rotation and displayed on the screen: On the left, the results of the placement of the electric angle when the motor turns in the opposite direction of the desired direction. On the right, the electric angle when the motor turns in the right direction. On top of the screen, it is indicated the average value of the electric angle to enter on the workbench.
5.2 Save results
Click the Save button (Top Figure) to store the motor measurements for a later usage with the ST Motor Control workbench software tool. Figure Top shows the saving window in that case. The user can then provide motor information: Naming profiled motor and Provide details about profiled motor.
5.3 Pole pair detection
Pole pair detection is a new feature that comes with this profiler and does not require a power generator to detect the pole pair number. To use this feature, click the Detect pole pairs button which will open a new window.

To start detection, click Next.

In this window, enter the value of the current to be injected to make the motor strong enough to be able to turn it manually afterwards. The value entered must be close to 15% of the maximum current that the motor can support. Otherwise, the motor may overheat.

Please apply a mark on the fixed part of the motor and the rotating part, then you can turn the rotating part and count the number of Pole Pair. The firmware then prepares the motor by applying a current ramp of the value entered in the previous step.

You have 15 seconds to make a complete rotation of the rotating part of the motor and must count the number of notches. This number will be the number of Pole Pairs. Then, click Finish.

Finally, you can can enter the number of Pole Pairs found, then close the window and start the Motor profiling.

5.4 Errors
5.4.1 Firmware errors
- FOC Duration: This fault appears when the FOC execution rate is too high and the FOC algorithm computation does not fit in the PWM period.
- Over Voltage: This fault appears when an overvoltage is applied to the power board.
- Under Voltage: This fault appears when an undervoltage is applied to the power board.
- Over heat: This fault appears when the power board is overheated.
- Speed feed back: This fault appears when the estimated speed is not reliable during the rev-up phases.
- Over current: This fault appears when an overvoltage is applied to the power board.
- Software error: This fault appears when a software error occurs, these errors are independent of the motor operation.
5.4.2 Pole pair required
This fault appears when the user forgot to write the Pole pairs value. In this case, the pole pairs text field is displayed in red.
5.4.3 Too many devices
This fault appears when 2 devices with ST-Link are connected to the computer. Only one device must be connected at a time.
5.4.4 Old firmware
This error appears when an old ST-Link firmware is used, it is necessary to have a recent ST-Link firmware for the checks made by the profiler to be carried out correctly.
5.4.5 No ST-Link ready to use
This error appears when the ST-Link are used by another software (CubeProgrammer, Iar). The checks made by the ST-Link can not be made. This prevents the profiler from working properly.
5.4.6 Error detected
This error appears when one of the errors present in the Firmware chapter is present. You must acknowledge the faults to start the profile.